AI systems are creating huge amounts of data at a rapid rate. While this flood of information is extremely valuable, it is also difficult to analyse and understand. Organisations need to make sense of these large data sets to derive useful insights and make better decisions. Data visualisation plays a pivotal role in the interpretation of complex data, making it accessible, understandable, and actionable. Well-designed visualisation can translate complex, high-dimensional data into intuitive, visually appealing representations, helping stakeholders to understand patterns, trends, and anomalies that would otherwise be challenging to recognise.
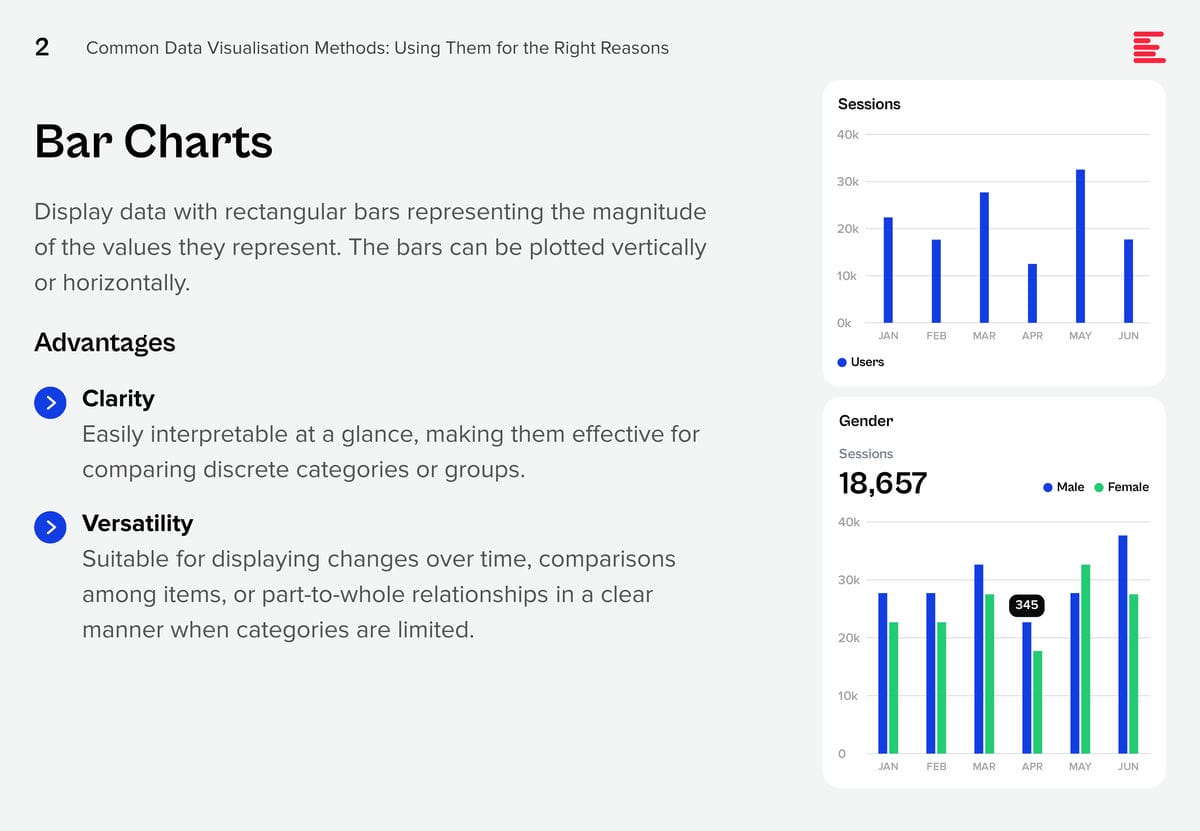
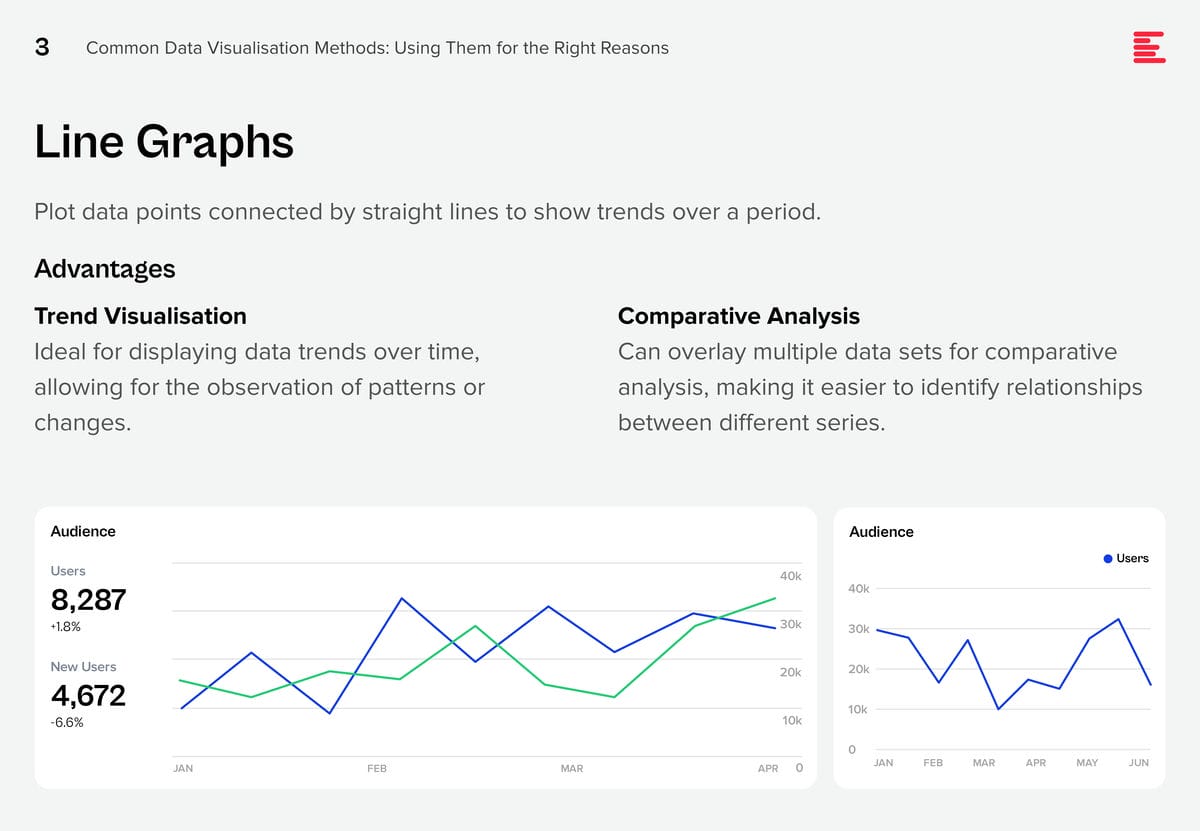
There are some data visualisation methods that you are using already; and some that you definitely should master as data complexity increases and there is more demand from business teams for better data visualisation.

Download Common Data Visualisation Methods as a PDF
Add These to Your Data Visualisation Repertoire
There are additional visualisation tools that you should be using to tell a better data story. Each of these visualisation techniques serves specific purposes in data analysis, offering unique advantages for representing data insights.
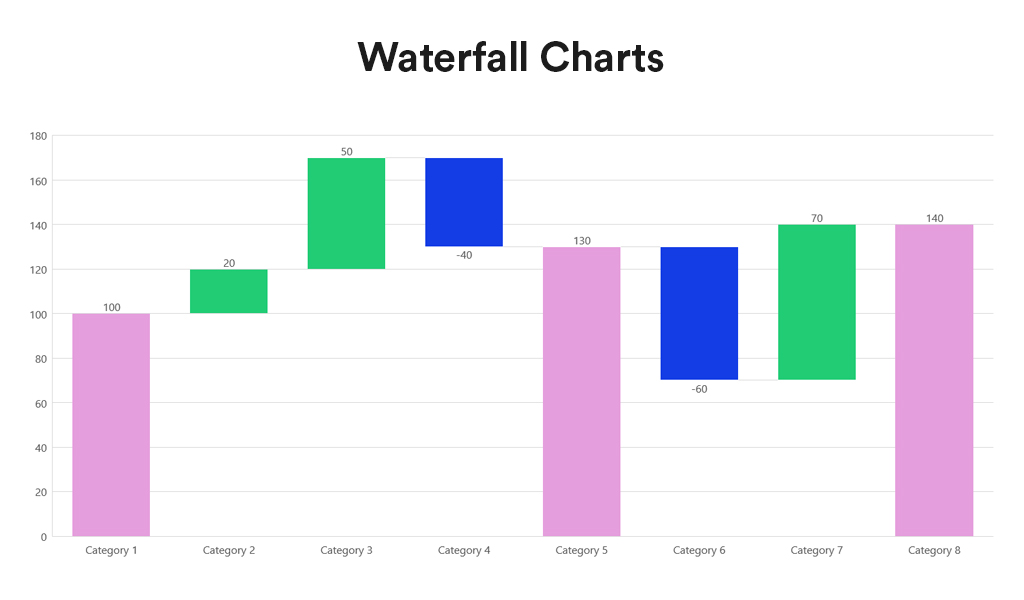
Waterfall charts depict the impact of intermediate positive and negative values on an initial value, often resulting in a final value. They are commonly employed in financial analysis to illustrate the contribution of various factors to a total, making them ideal for visualising step-by-step financial contributions or tracking the cumulative effect of sequentially introduced factors.
Advantages:
- Sequential Analysis. Ideal for understanding the cumulative effect of sequentially introduced positive or negative values.
- Financial Reporting. Commonly used for financial statements to break down the contributions of various elements to a net result, such as revenues, costs, and profits over time.
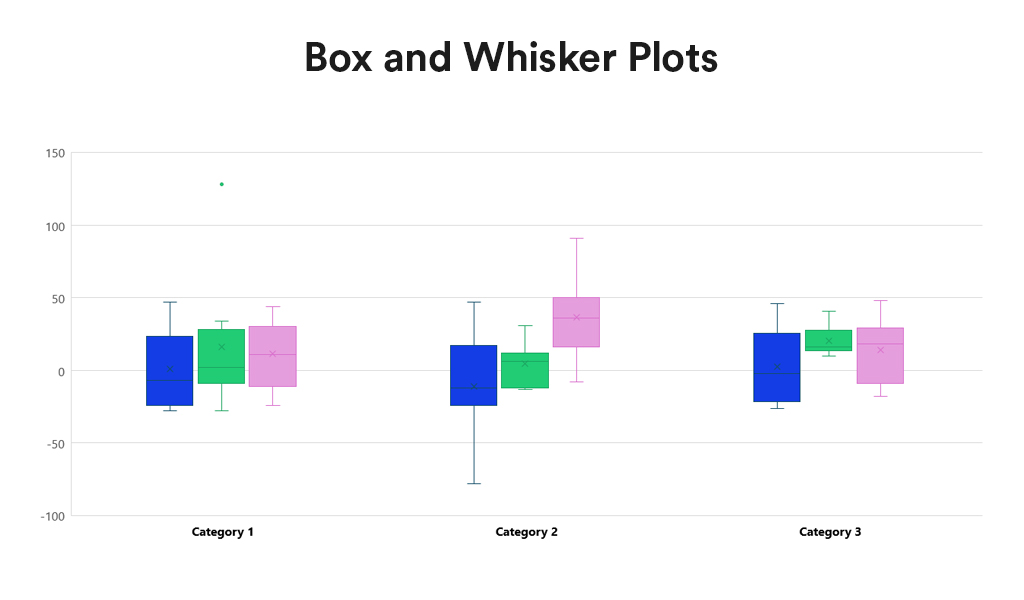
Box and Whisker Plots summarise data distribution using a five-number summary: minimum, first quartile (Q1), median, third quartile (Q3), and maximum. They are valuable for showcasing data sample variations without relying on specific statistical assumptions. Box and Whisker Plots excel in comparing distributions across multiple groups or datasets, providing a concise overview of various statistics.
Advantages:
- Distribution Clarity. Provide a clear view of the data distribution, including its central tendency, variability, and skewness.
- Outlier Identification. Easily identify outliers, offering insights into the spread and symmetry of the data.
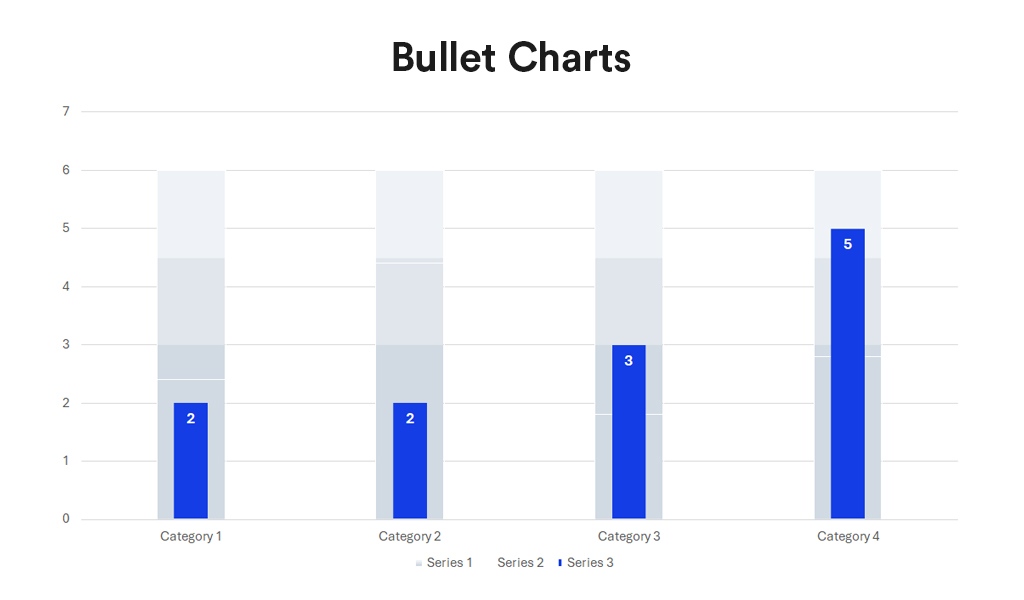
Bullet charts, a bar graph variant, serve as a replacement for dashboard gauges and meters. They showcase a primary measure alongside one or more other measures for context, such as a target or previous period’s performance, often incorporating qualitative ranges like poor, satisfactory, and good. Ideal for performance dashboards with limited space, bullet charts efficiently demonstrate progress towards goals.
Advantages:
- Compactness. Offer a compact and straightforward way to monitor performance against a target.
- Efficiency. More efficient than gauges and meters in dashboard design, as they take up less space and can display more information, making them ideal for comparing multiple measures.
Conclusion
Each data visualisation type has its unique strengths, making it better suited for certain types of data and analysis than others. The key to effective data visualisation lies in matching the visualisation type to your data’s specific needs, considering the story you want, to tell or the insights you aim to glean. Choosing the right data representation helps you to make informed decisions that enhance your data analysis and communication efforts.
Incorporating Waterfall Charts, Box and Whisker Plots, and Bullet Charts into the data visualisation toolkit allows for a broader range of insights to be derived from your data. From analysing financial data, comparing distributions, to tracking performance metrics, these additional types of visualisation can communicate complex data stories clearly and effectively. As with all data visualisation, the key is to choose the type that best matches the organisation’s data story, making it accessible and understandable to the audience.

Technology is reshaping the Public Sector worldwide, optimising operations, improving citizen services, and fostering data-driven decision-making. Government agencies are also embracing innovation for effective governance in this digital era.
Public sector organisations worldwide recognise the need for swift and agile interventions. With citizen expectations resembling those of commercial customers, public sector organisations face mounting pressure to break down the barriers to provide seamless service experiences.
Read on to find out how public sector organisations in countries such as Australia, Vietnam, the Philippines, South Korea, and Singapore are innovating to stay ahead of the curve; and what Ecosystm VP Consulting, Peter Carr sees as the Future of Public Sector.


Click here to Download ‘The Future of the Public Sector’ as a PDF

Data & AI initiatives are firmly at the core of any organisation’s tech-led transformation efforts. Businesses today realise the value of real-time data insights to deliver the agility that is required to succeed in today’s competitive, and often volatile, market.
But organisations continue to struggle with their data & AI initiatives for a variety of reasons. Organisations in ASEAN report some common challenges in implementing successful data & AI initiatives.
Here are 5 insights to build scalable AI.
- Data Access a Key Stumbling Block. Many organisations find that they no longer need to rely on centralised data repositories.
- Organisations Need Data Creativity. A true data-first organisation derives value from their data & AI investments across the entire organisation, cross-leveraging data.
- Governance Not Built into Organisational Psyche. A data-first organisation needs all employees to have a data-driven mindset. This can only be driven by clear guidelines that are laid out early on and adhered to by data generators, managers, and consumers.
- Lack of End-to-End Data Lifecycle Management. It is critical to have observability, intelligence, and automation built into the entire data lifecycle.
- Democratisation of Data & AI Should Be the Goal. The true value of data & AI solutions will be fully realised when the people who benefit from the solutions are the ones managing the solutions and running the queries that will help them deliver better value to the business.
Read below to find out more.


Download 5 Insights to Help Organisations Build Scalable AI – An ASEAN View as a PDF


The Healthcare industry has achieved much in the last two years, despite all the struggles and pivots. However, the impact of COVID-19 on the industry is far from over.
2020 was focused on finding a vaccine against the virus, setting treatment protocols, and workforce management to handle the emergency. 2021 was focused on vaccine distribution and administration. 2022 will be the year when we start seeing the second-order impacts of the pandemic – and see healthcare providers address these impacts.
In 2022 the key drivers of the ongoing transformation in Healthcare will be:
- Patients. Improved self-knowledge and ownership of personal health outcomes and data
- Technology. Widespread availability and adoption of digital and cognitive technologies
- Employees. The ongoing challenges of clinical and administrative staff
- The Life Sciences Industry. The recent investments in, and success of the sector
- Policy Makers. The sharp increase in focus on population health
- Continued Uncertainty. Around challenges such as new virus strains, anti-vaccine protests, supply chain disruptions etc.
Read on to find out what Ecosystm Analysts Amit Rana, Krish Krishnan, and Sash Mukherjee think are the key achievements of the industry and the future trends in 2022 and beyond.


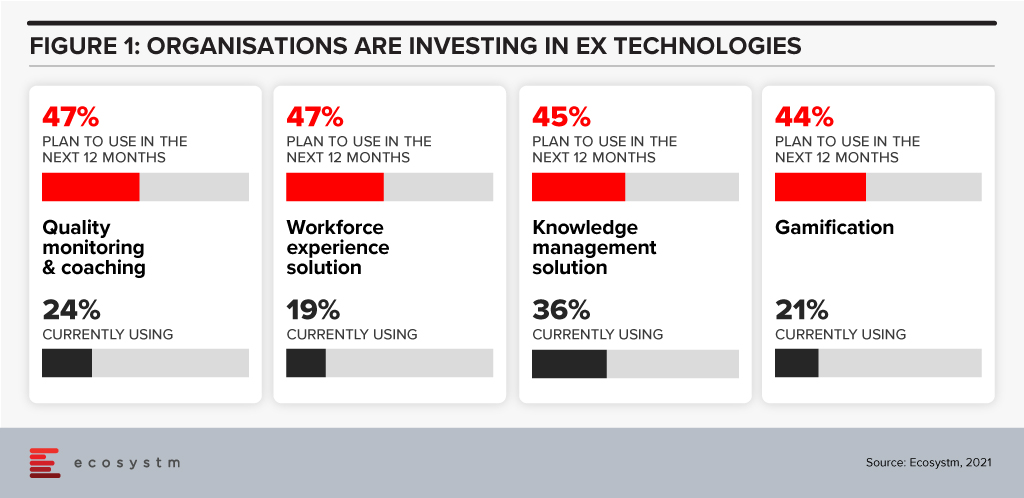
Agents are the biggest assets in a contact centre and agent attrition is not a new challenge – 40% of contact centres globally state that high staff turnover is one of the challenges of driving consistent customer experience (CX). The ability to find the right talent has been equally challenging. The pandemic and the hybrid work model have made it harder to manage the onboarding, training, and the other processes required to get the agent up to speed on the job. Despite the challenges contact centres need a strong focus on managing the experience for the agents – they are a company’s front-line staff and the experience they deliver to the customers has an immense impact on the brand.
Workforce Experience Management (WEM) tools have gone beyond just scheduling – they are now able to leverage data and analytics to allow agents more control over their performance and their work preferences. Additionally, Agent Assist and knowledge management solutions give contact centre agents dynamic access to intelligent data. Ecosystm research shows that contact centres across the globe are ramping up their investments in employee experience (EX) technologies (Figure 1). They are focused on simplifying agent workload and offering more flexibility.
How do you elevate the Agent Experience in the Hybrid Work Model?
- Encourage shift bidding. Build flexible scheduling and shift bidding into the company culture. Agents should be encouraged to work on a schedule that works best for them. If you are employing part-timers, retirees or you have agents working from home, you have to factor in their home commitments. Additionally allowing them to bid and openly talk to their managers and colleagues about swapping shifts demonstrates a company culture of open communication and collaboration. So, in essence, this is not a scheduling conversation, but an image-building exercise. You will be able to attract more talent, in an industry where it is hard to retain talent.
- Evaluate your agents’ strengths in voice and self-service channels. Not all agents are good with voice calls and this can sometimes be overlooked by contact centre leaders. Your organisation’s brand image depends on the customer care your employees provide. Voice calls are still important; despite the increase in the adoption of AI and automation, the human touch remains critical. It is important for agents to be as authentic as possible on calls. Assigning the right agent to the right channel, keeping in mind their strengths and weaknesses will help your organisation to maintain the human touch. For example, some agents may be able to multitask well and are better prepared to manage multiple channels simultaneously.
- Your knowledge system is critical. Make sure it is relevant and not outdated! Your agents have limited time on their hands. They often need information urgently, especially when dealing with a difficult customer. An updated knowledge system allows your agents to be consistent in their messages and their delivery. This helps agents to meet the AHT, FCR and other metrics and reduces human errors. Nearly 60% of contact centres globally rate improving knowledge management systems as a CX priority. There is still a lot of data inconsistency and irrelevance which needs to be worked through. An accurate and updated knowledge management system is critical, and it should be ONE source of truth. For compliance reasons, data consistency is critical. Also, the search for the information must be easy and only relevant articles and information should be pushed to live agents. The need to access multiple knowledge systems and CRM tools creates additional stress on agents.
- Give your agents access to call recordings. When your agents have access to the call recordings, they can evaluate how they have performed; and reflect and improve on the outcomes at their own pace. This will also allow them to spot the mistakes they are making, often prompting them to reach out to their manager and/or colleagues for help on how to avoid them. Often managers have access to sentiment analysis applications to spot issues from the tones of the agents and the customers. This can be useful in situations where the agent might have provided the right answers, but the customer is not fully satisfied. Giving equal access to the agents empowers them to find ways of improving the CX they deliver.
- Invest in advanced technologies around forecasting and scheduling. AI and self-adjusting algorithms are important for accurate and real-time forecasts. It is challenging to sometimes predict the volume of voice and non-voice transactions in a day. API-based tools can integrate data from different sources such as web chat, social media, voice, and workforce experience management solutions for an accurate view of the workload, including wait times. The analytics should be able to alert you of potential gaps before the resource shortfall, allowing you to plan your staffing requirements better.
Conclusion
The hybrid work model has its challenges for the contact centre industry. The ability of agents to walk up to their supervisors or raise their hands when they have an issue has been impacted. While it is important to focus on how agents will perform their jobs remotely, it is equally important to evaluate the overall experience including training, scheduling and forecasting workload. AI and automation, WEM and knowledge solutions can help reduce confusion and ease the workload for the agents. An integrated EX platform that uses a single dashboard will be most beneficial for agents to navigate for information. What is important is to have a new approach to managing EX. This will help your organisation immensely in attracting and retaining talent.