
Historically, data scientists have been the linchpins in the world of AI and machine learning, responsible for everything from data collection and curation to model training and validation. However, as the field matures, we’re witnessing a significant shift towards specialisation, particularly in data engineering and the strategic role of Large Language Models (LLMs) in data curation and labelling. The integration of AI into applications is also reshaping the landscape of software development and application design.
The Growth of Embedded AI
AI is being embedded into applications to enhance user experience, optimise operations, and provide insights that were previously inaccessible. For example, natural language processing (NLP) models are being used to power conversational chatbots for customer service, while machine learning algorithms are analysing user behaviour to customise content feeds on social media platforms. These applications leverage AI to perform complex tasks, such as understanding user intent, predicting future actions, or automating decision-making processes, making AI integration a critical component of modern software development.
This shift towards AI-embedded applications is not only changing the nature of the products and services offered but is also transforming the roles of those who build them. Since the traditional developer may not possess extensive AI skills, the role of data scientists is evolving, moving away from data engineering tasks and increasingly towards direct involvement in development processes.
The Role of LLMs in Data Curation
The emergence of LLMs has introduced a novel approach to handling data curation and processing tasks traditionally performed by data scientists. LLMs, with their profound understanding of natural language and ability to generate human-like text, are increasingly being used to automate aspects of data labelling and curation. This not only speeds up the process but also allows data scientists to focus more on strategic tasks such as model architecture design and hyperparameter tuning.
The accuracy of AI models is directly tied to the quality of the data they’re trained on. Incorrectly labelled data or poorly curated datasets can lead to biased outcomes, mispredictions, and ultimately, the failure of AI projects. The role of data engineers and the use of advanced tools like LLMs in ensuring the integrity of data cannot be overstated.
The Impact on Traditional Developers
Traditional software developers have primarily focused on writing code, debugging, and software maintenance, with a clear emphasis on programming languages, algorithms, and software architecture. However, as applications become more AI-driven, there is a growing need for developers to understand and integrate AI models and algorithms into their applications. This requirement presents a challenge for developers who may not have specialised training in AI or data science. This is seeing an increasing demand for upskilling and cross-disciplinary collaboration to bridge the gap between traditional software development and AI integration.
Clear Role Differentiation: Data Engineering and Data Science
In response to this shift, the role of data scientists is expanding beyond the confines of traditional data engineering and data science, to include more direct involvement in the development of applications and the embedding of AI features and functions.
Data engineering has always been a foundational element of the data scientist’s role, and its importance has increased with the surge in data volume, variety, and velocity. Integrating LLMs into the data collection process represents a cutting-edge approach to automating the curation and labelling of data, streamlining the data management process, and significantly enhancing the efficiency of data utilisation for AI and ML projects.
Accurate data labelling and meticulous curation are paramount to developing models that are both reliable and unbiased. Errors in data labelling or poorly curated datasets can lead to models that make inaccurate predictions or, worse, perpetuate biases. The integration of LLMs into data engineering tasks is facilitating a transformation, freeing them from the burdens of manual data labelling and curation. This has led to a more specialised data scientist role that allocates more time and resources to areas that can create greater impact.
The Evolving Role of Data Scientists
Data scientists, with their deep understanding of AI models and algorithms, are increasingly working alongside developers to embed AI capabilities into applications. This collaboration is essential for ensuring that AI models are effectively integrated, optimised for performance, and aligned with the application’s objectives.
- Model Development and Innovation. With the groundwork of data preparation laid by LLMs, data scientists can focus on developing more sophisticated and accurate AI models, exploring new algorithms, and innovating in AI and ML technologies.
- Strategic Insights and Decision Making. Data scientists can spend more time analysing data and extracting valuable insights that can inform business strategies and decision-making processes.
- Cross-disciplinary Collaboration. This shift also enables data scientists to engage more deeply in interdisciplinary collaboration, working closely with other departments to ensure that AI and ML technologies are effectively integrated into broader business processes and objectives.
- AI Feature Design. Data scientists are playing a crucial role in designing AI-driven features of applications, ensuring that the use of AI adds tangible value to the user experience.
- Model Integration and Optimisation. Data scientists are also involved in integrating AI models into the application architecture, optimising them for efficiency and scalability, and ensuring that they perform effectively in production environments.
- Monitoring and Iteration. Once AI models are deployed, data scientists work on monitoring their performance, interpreting outcomes, and making necessary adjustments. This iterative process ensures that AI functionalities continue to meet user needs and adapt to changing data landscapes.
- Research and Continued Learning. Finally, the transformation allows data scientists to dedicate more time to research and continued learning, staying ahead of the rapidly evolving field of AI and ensuring that their skills and knowledge remain cutting-edge.
Conclusion
The integration of AI into applications is leading to a transformation in the roles within the software development ecosystem. As applications become increasingly AI-driven, the distinction between software development and AI model development is blurring. This convergence needs a more collaborative approach, where traditional developers gain AI literacy and data scientists take on more active roles in application development. The evolution of these roles highlights the interdisciplinary nature of building modern AI-embedded applications and underscores the importance of continuous learning and adaptation in the rapidly advancing field of AI.

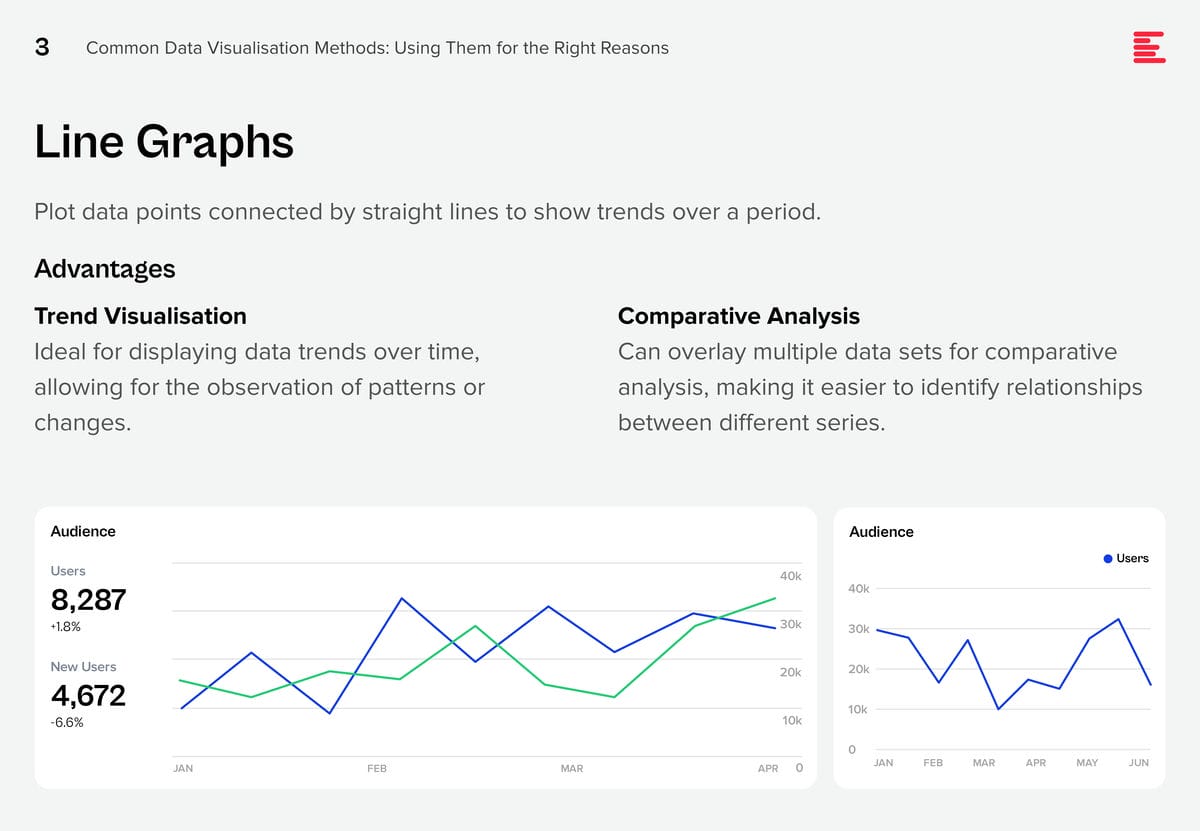
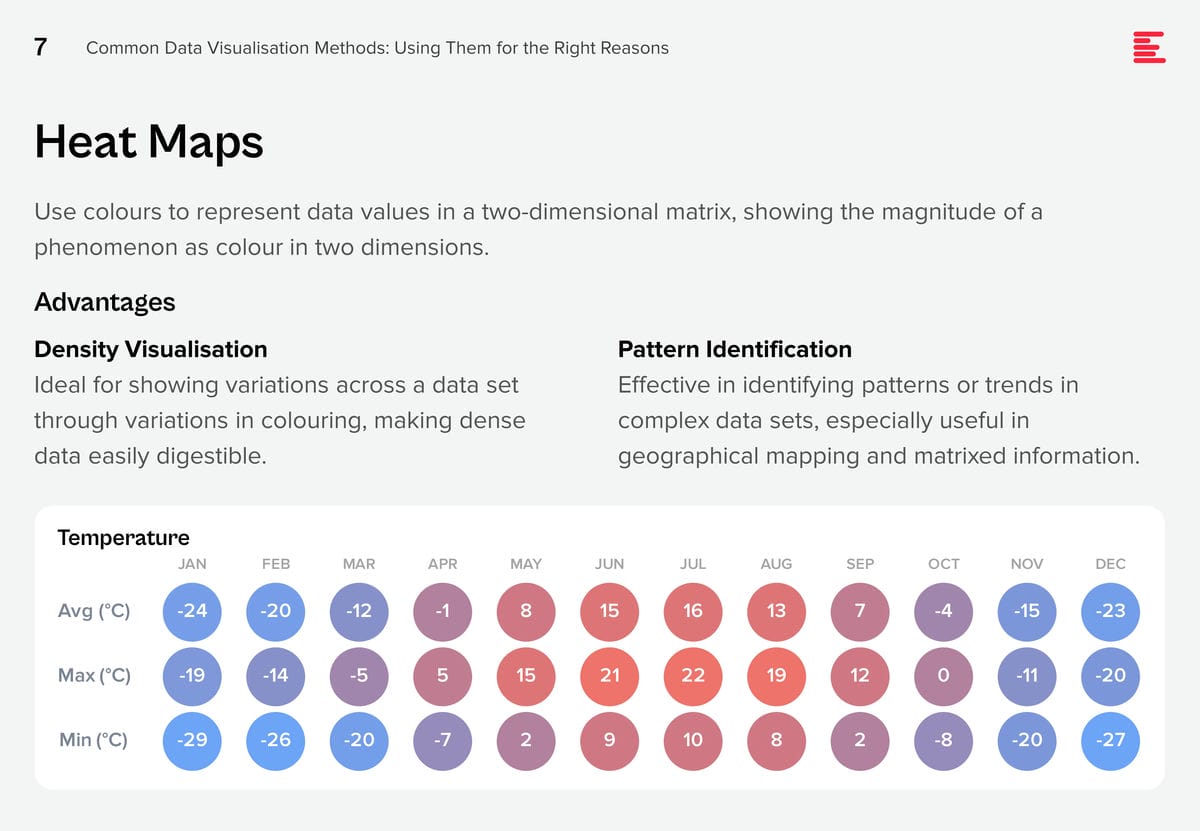
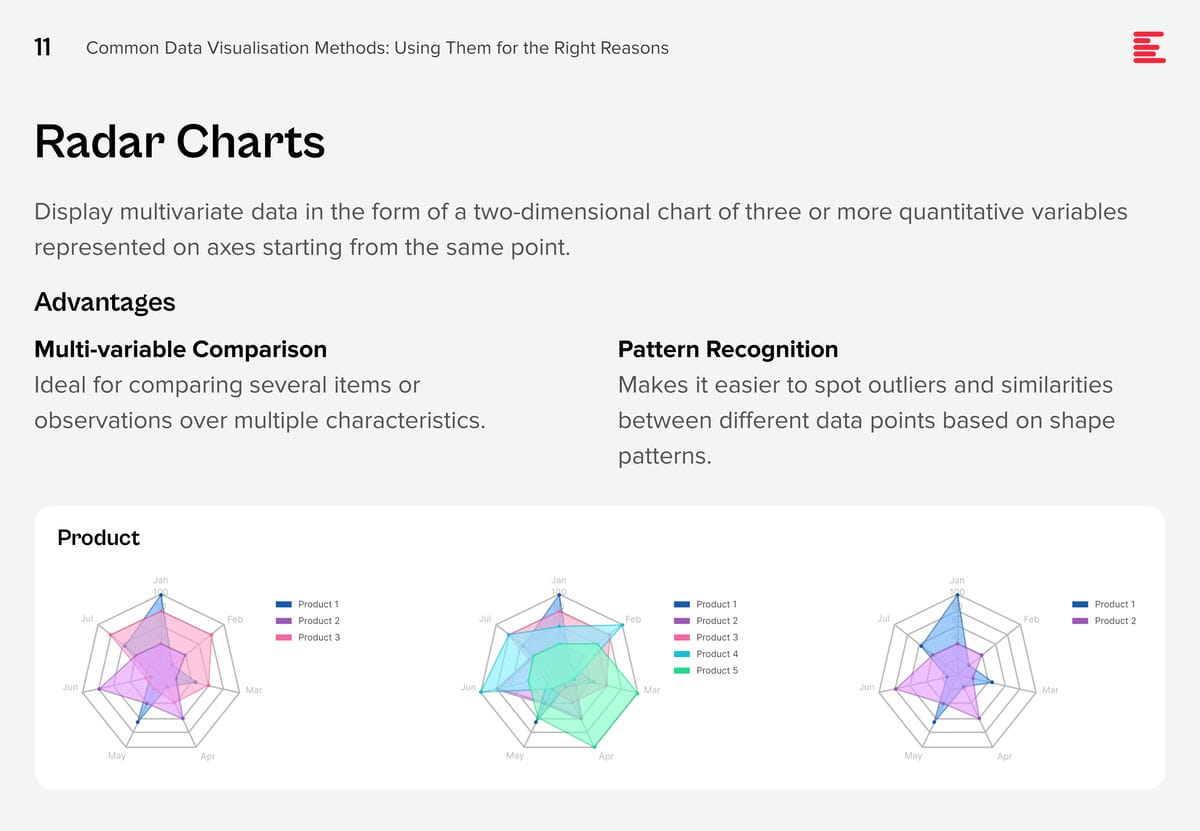
AI systems are creating huge amounts of data at a rapid rate. While this flood of information is extremely valuable, it is also difficult to analyse and understand. Organisations need to make sense of these large data sets to derive useful insights and make better decisions. Data visualisation plays a pivotal role in the interpretation of complex data, making it accessible, understandable, and actionable. Well-designed visualisation can translate complex, high-dimensional data into intuitive, visually appealing representations, helping stakeholders to understand patterns, trends, and anomalies that would otherwise be challenging to recognise.
There are some data visualisation methods that you are using already; and some that you definitely should master as data complexity increases and there is more demand from business teams for better data visualisation.


Download Common Data Visualisation Methods as a PDF
Add These to Your Data Visualisation Repertoire
There are additional visualisation tools that you should be using to tell a better data story. Each of these visualisation techniques serves specific purposes in data analysis, offering unique advantages for representing data insights.
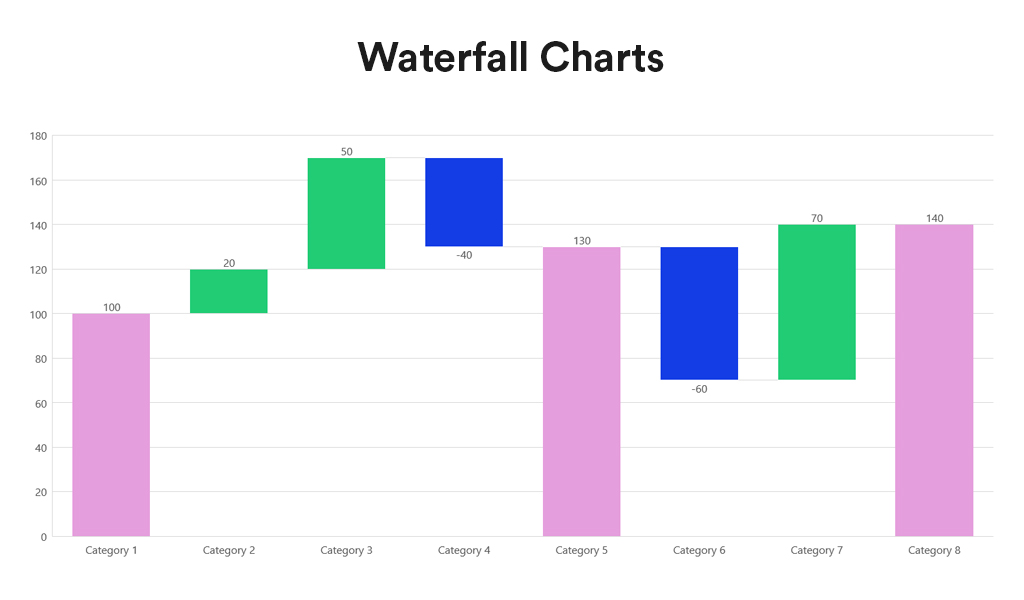
Waterfall charts depict the impact of intermediate positive and negative values on an initial value, often resulting in a final value. They are commonly employed in financial analysis to illustrate the contribution of various factors to a total, making them ideal for visualising step-by-step financial contributions or tracking the cumulative effect of sequentially introduced factors.
Advantages:
- Sequential Analysis. Ideal for understanding the cumulative effect of sequentially introduced positive or negative values.
- Financial Reporting. Commonly used for financial statements to break down the contributions of various elements to a net result, such as revenues, costs, and profits over time.
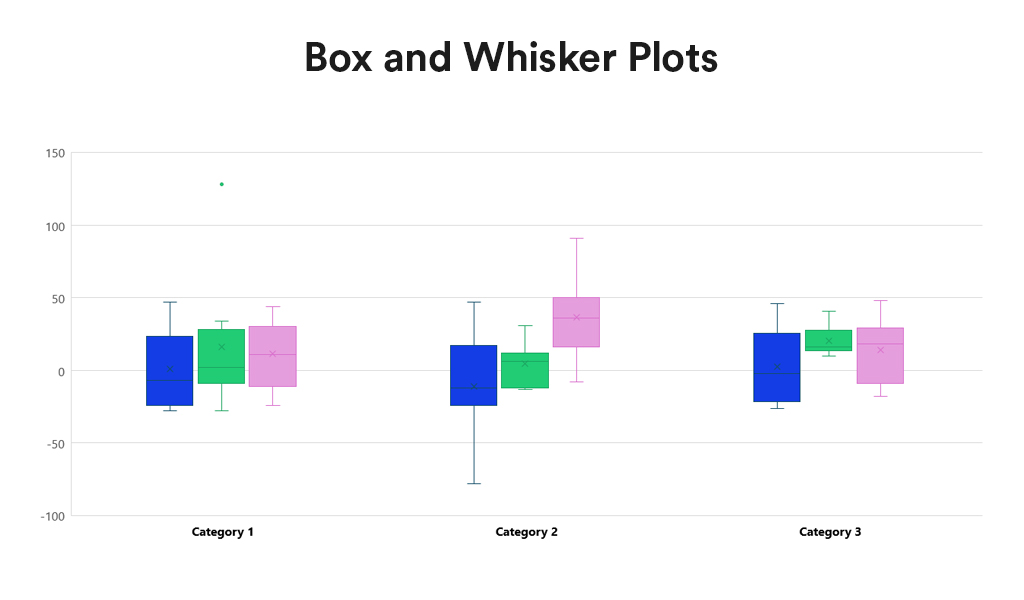
Box and Whisker Plots summarise data distribution using a five-number summary: minimum, first quartile (Q1), median, third quartile (Q3), and maximum. They are valuable for showcasing data sample variations without relying on specific statistical assumptions. Box and Whisker Plots excel in comparing distributions across multiple groups or datasets, providing a concise overview of various statistics.
Advantages:
- Distribution Clarity. Provide a clear view of the data distribution, including its central tendency, variability, and skewness.
- Outlier Identification. Easily identify outliers, offering insights into the spread and symmetry of the data.
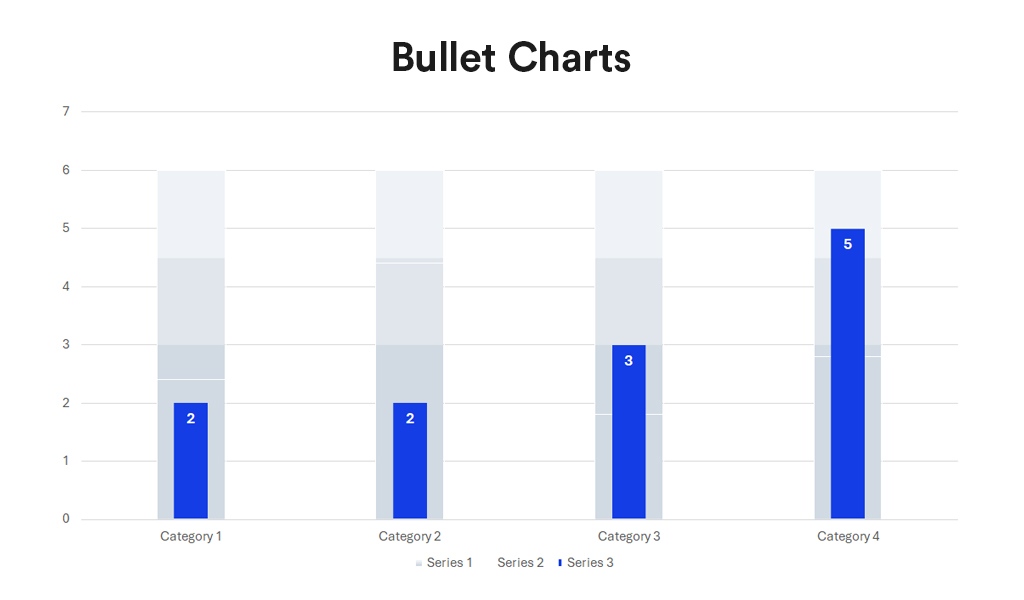
Bullet charts, a bar graph variant, serve as a replacement for dashboard gauges and meters. They showcase a primary measure alongside one or more other measures for context, such as a target or previous period’s performance, often incorporating qualitative ranges like poor, satisfactory, and good. Ideal for performance dashboards with limited space, bullet charts efficiently demonstrate progress towards goals.
Advantages:
- Compactness. Offer a compact and straightforward way to monitor performance against a target.
- Efficiency. More efficient than gauges and meters in dashboard design, as they take up less space and can display more information, making them ideal for comparing multiple measures.
Conclusion
Each data visualisation type has its unique strengths, making it better suited for certain types of data and analysis than others. The key to effective data visualisation lies in matching the visualisation type to your data’s specific needs, considering the story you want, to tell or the insights you aim to glean. Choosing the right data representation helps you to make informed decisions that enhance your data analysis and communication efforts.
Incorporating Waterfall Charts, Box and Whisker Plots, and Bullet Charts into the data visualisation toolkit allows for a broader range of insights to be derived from your data. From analysing financial data, comparing distributions, to tracking performance metrics, these additional types of visualisation can communicate complex data stories clearly and effectively. As with all data visualisation, the key is to choose the type that best matches the organisation’s data story, making it accessible and understandable to the audience.