
At a recently held Ecosystm roundtable, in partnership with Qlik and 121Connects, Ecosystm Principal Advisor Manoj Chugh, moderated a conversation where Indian tech and data leaders discussed building trust in data strategies. They explored ways to automate data pipelines and improve governance to drive better decisions and business outcomes. Here are the key takeaways from the session.

Data isn’t just a byproduct anymore; it’s the lifeblood of modern businesses, fuelling informed decisions and strategic growth. But with vast amounts of data, the challenge isn’t just managing it; it’s building trust. AI, once a beacon of hope, is now at risk without a reliable data foundation. Ecosystm research reveals that a staggering 66% of Indian tech leaders doubt their organisation’s data quality, and the problem of data silos is exacerbating this trust crisis.
At the Leaders Roundtable in Mumbai, I had the opportunity to moderate a discussion among data and digital leaders on the critical components of building trust in data and leveraging it to drive business value. The consensus was that building trust requires a comprehensive strategy that addresses the complexities of data management and positions the organisation for future success. Here are the key strategies that are essential for achieving these goals.
1. Adopting a Unified Data Approach
Organisations are facing a growing wave of complex workloads and business initiatives. To manage this expansion, IT teams are turning to multi-cloud, SaaS, and hybrid environments. However, this diverse landscape introduces new challenges, such as data silos, security vulnerabilities, and difficulties in ensuring interoperability between systems.

A unified data strategy is crucial to overcome these challenges. By ensuring platform consistency, robust security, and seamless data integration, organisations can simplify data management, enhance security, and align with business goals – driving informed decisions, innovation, and long-term success.
Real-time data integration is essential for timely data availability, enabling organisations to make data-driven decisions quickly and effectively. By integrating data from various sources in real-time, businesses can gain valuable insights into their operations, identify trends, and respond to changing market conditions.
Organisations that are able to integrate their IT and operational technology (OT) systems find their data accuracy increasing. By combining IT’s digital data management expertise with OT’s real-time operational insights, organisations can ensure more accurate, timely, and actionable data. This integration enables continuous monitoring and analysis of operational data, leading to faster identification of errors, more precise decision-making, and optimised processes.
2. Enhancing Data Quality with Automation and Collaboration
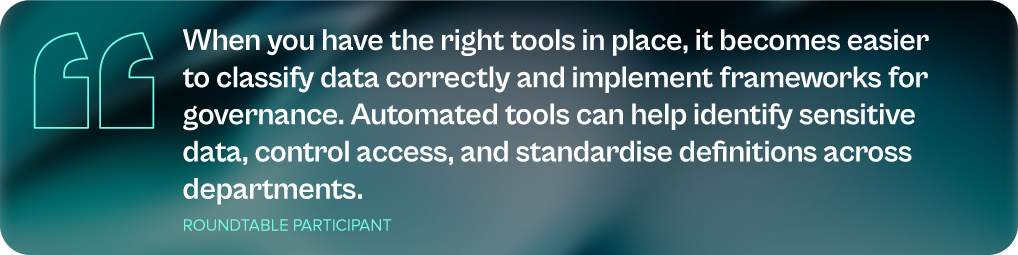
As the volume and complexity of data continue to grow, ensuring high data quality is essential for organisations to make accurate decisions and to drive trust in data-driven solutions. Automated data quality tools are useful for cleansing and standardising data to eliminate errors and inconsistencies.
As mentioned earlier, integrating IT and OT systems can help organisations improve operational efficiency and resilience. By leveraging data-driven insights, businesses can identify bottlenecks, optimise workflows, and proactively address potential issues before they escalate. This can lead to cost savings, increased productivity, and improved customer satisfaction.
However, while automation technologies can help, organisations must also invest in training employees in data management, data visualisation, and data governance.
3. Modernising Data Infrastructure for Agility and Innovation
In today’s fast-paced business landscape, agility is paramount. Modernising data infrastructure is essential to remain competitive – the right digital infrastructure focuses on optimising costs, boosting capacity and agility, and maximising data leverage, all while safeguarding the organisation from cyber threats. This involves migrating data lakes and warehouses to cloud platforms and adopting advanced analytics tools. However, modernisation efforts must be aligned with specific business goals, such as enhancing customer experiences, optimising operations, or driving innovation. A well-modernised data environment not only improves agility but also lays the foundation for future innovations.

Technology leaders must assess whether their data architecture supports the organisation’s evolving data requirements, considering factors such as data flows, necessary management systems, processing operations, and AI applications. The ideal data architecture should be tailored to the organisation’s specific needs, considering current and future data demands, available skills, costs, and scalability.
4. Strengthening Data Governance with a Structured Approach
Data governance is crucial for establishing trust in data, and providing a framework to manage its quality, integrity, and security throughout its lifecycle. By setting clear policies and processes, organisations can build confidence in their data, support informed decision-making, and foster stakeholder trust.
A key component of data governance is data lineage – the ability to trace the history and transformation of data from its source to its final use. Understanding this journey helps organisations verify data accuracy and integrity, ensure compliance with regulatory requirements and internal policies, improve data quality by proactively addressing issues, and enhance decision-making through context and transparency.
A tiered data governance structure, with strategic oversight at the executive level and operational tasks managed by dedicated data governance councils, ensures that data governance aligns with broader organisational goals and is implemented effectively.
Are You Ready for the Future of AI?
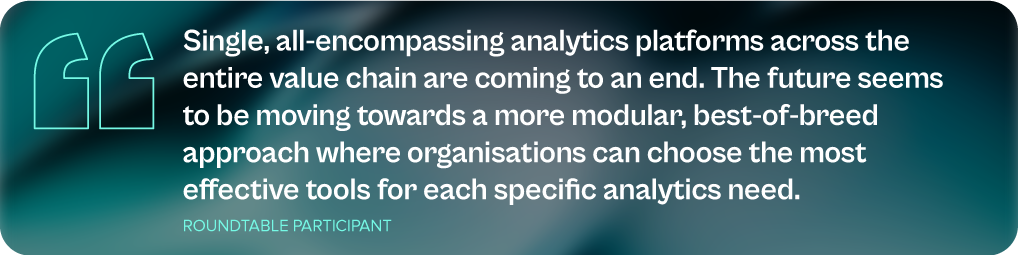
The ultimate goal of your data management and discovery mechanisms is to ensure that you are advancing at pace with the industry. The analytics landscape is undergoing a profound transformation, promising to revolutionise how organisations interact with data. A key innovation, the data fabric, is enabling organisations to analyse unstructured data, where the true value often lies, resulting in cleaner and more reliable data models.
GenAI has emerged as another game-changer, empowering employees across the organisation to become citizen data scientists. This democratisation of data analytics allows for a broader range of insights and fosters a more data-driven culture. Organisations can leverage GenAI to automate tasks, generate new ideas, and uncover hidden patterns in their data.
The shift from traditional dashboards to real-time conversational tools is also reshaping how data insights are delivered and acted upon. These tools enable users to ask questions in natural language, receiving immediate and relevant answers based on the underlying data. This conversational approach makes data more accessible and actionable, empowering employees to make data-driven decisions at all levels of the organisation.
To fully capitalise on these advancements, organisations need to reassess their AI/ML strategies. By ensuring that their tech initiatives align with their broader business objectives and deliver tangible returns on investment, organisations can unlock the full potential of data-driven insights and gain a competitive edge. It is equally important to build trust in AI initiatives, through a strong data foundation. This involves ensuring data quality, accuracy, and consistency, as well as implementing robust data governance practices. A solid data foundation provides the necessary groundwork for AI and GenAI models to deliver reliable and valuable insights.

Data analysts play a vital role in today’s data-driven world, providing crucial insights that benefit decision-making processes. For those with a knack for numbers and a passion for uncovering patterns, a career as a data analyst can be both fulfilling and lucrative – it can also be a stepping stone towards other careers in data. While a data analyst focuses on data preparation and visualisation, an AI engineer specialises in creating AI solutions, a machine learning (ML) engineer concentrates on implementing ML models, and a data scientist combines elements of data analysis and ML to derive insights and predictions from data.
Tools, Skills, and Techniques of a Data Analyst
Excel Mastery. Unlocks a powerful toolbox for data manipulation and analysis. Essential skills include using a vast array of functions for calculations and data transformation. Pivot tables become your secret weapon for summarising and analysing large datasets, while charts and graphs bring your findings to life with visual clarity. Data validation ensures accuracy, and the Analysis ToolPak and Solver provide advanced functionalities for statistical analysis and complex problem-solving. Mastering Excel empowers you to transform raw data into actionable insights.
Advanced SQL. While basic skills handle simple queries, advanced users can go deeper with sorting, aggregation, and the art of JOINs to combine data from multiple tables. Common Table Expressions (CTEs) and subqueries become your allies for crafting complex queries, while aggregate functions summarise vast amounts of data. Window functions add another layer of power, allowing calculations within query results. Mastering Advanced SQL empowers you to extract hidden insights and manage data with unparalleled precision.
Data Visualisation. Crafts impactful data stories. These tools empower you to connect to various data sources, transform raw information into a usable format, and design interactive dashboards and reports. Filters and drilldowns allow users to explore your data from different angles, while calculated fields unlock deeper analysis. Parameters add a final touch of flexibility, letting viewers customise the report to their specific needs. With tools Tableau and Power BI, complex data becomes clear and engaging.
Essential Python. This powerful language excels at data analysis and automation. Libraries like NumPy and Pandas become your foundation for data manipulation and wrangling. Scikit-learn empowers you to build ML models, while SciPy and StatsModels provide a toolkit for in-depth statistical analysis. Python’s ability to interact with APIs and web scrape data expands its reach, and its automation capabilities streamline repetitive tasks. With Essential Python, you have the power to solve complex problems.
Automating the Journey. Data analysts can be masters of efficiency, and their skills translate beautifully into AI. Scripting languages like Ansible and Terraform automate repetitive tasks. Imagine streamlining the process of training and deploying AI models – a skill that directly benefits the AI development pipeline. This proficiency in automation showcases the valuable foundation data analysts provide for building and maintaining AI systems.
Developing ML Expertise. Transitioning from data analysis to AI involves building on your existing skills to develop ML expertise. As a data analyst, you may start with basic predictive models. This knowledge is expanded in AI to include deep learning and advanced ML algorithms. Also, skills in statistical analysis and visualisation help in evaluating the performance of AI models.
Growing Your AI Skills
Becoming an AI engineer requires building on a data analysis foundation to focus on advanced skills such as:
- Deep Learning. Learning frameworks like TensorFlow and PyTorch to build and train neural networks.
- Natural Language Processing (NLP). Techniques for processing and analysing large amounts of natural language data.
- AI Ethics and Fairness. Understanding the ethical implications of AI and ensuring models are fair and unbiased.
- Big Data Technologies. Using tools like Hadoop and Spark for handling large-scale data is essential for AI applications.
The Evolution of a Data Analyst: Career Opportunities
Data analysis is a springboard to AI engineering. Businesses crave talent that bridges the data-AI gap. Your data analyst skills provide the foundation (understanding data sources and transformations) to excel in AI. As you master ML, you can progress to roles like:
- AI Engineer. Works on integrating AI solutions into products and services. They work with AI frameworks like TensorFlow and PyTorch, ensuring that AI models are incorporated into products and services in a fair and unbiased manner.
- ML Engineer. Focuses on designing and implementing ML models. They focus on preprocessing data, evaluating model performance, and collaborating with data scientists and engineers to bring models into production. They need strong programming skills and experience with big data tools and ML algorithms.
- Data Scientist. Bridges the gap between data analysis and AI, often involved in both data preparation and model development. They perform exploratory data analysis, develop predictive models, and collaborate with cross-functional teams to solve complex business problems. Their role requires a comprehensive understanding of both data analysis and ML, as well as strong programming and data visualisation skills.
Conclusion
Hone your data expertise and unlock a future in AI! Mastering in-demand skills like Excel, SQL, Python, and data visualisation tools will equip you to excel as a data analyst. Your data wrangling skills will be invaluable as you explore ML and advanced algorithms. Also, your existing BI knowledge translates seamlessly into building and evaluating AI models. Remember, the data landscape is constantly evolving, so continue to learn to stay at the forefront of this dynamic field. By combining your data skills with a passion for AI, you’ll be well-positioned to tackle complex challenges and shape the future of AI.
The data architecture outlines how data is managed in an organisation and is crucial for defining the data flow, data management systems required, the data processing operations, and AI applications. Data architects and engineers define data models and structures based on these requirements, supporting initiatives like data science. Before we delve into the right data architecture for your AI journey, let’s talk about the data management options. Technology leaders have the challenge of deciding on a data management system that takes into consideration factors such as current and future data needs, available skills, costs, and scalability. As data strategies become vital to business success, selecting the right data management system is crucial for enabling data-driven decisions and innovation.
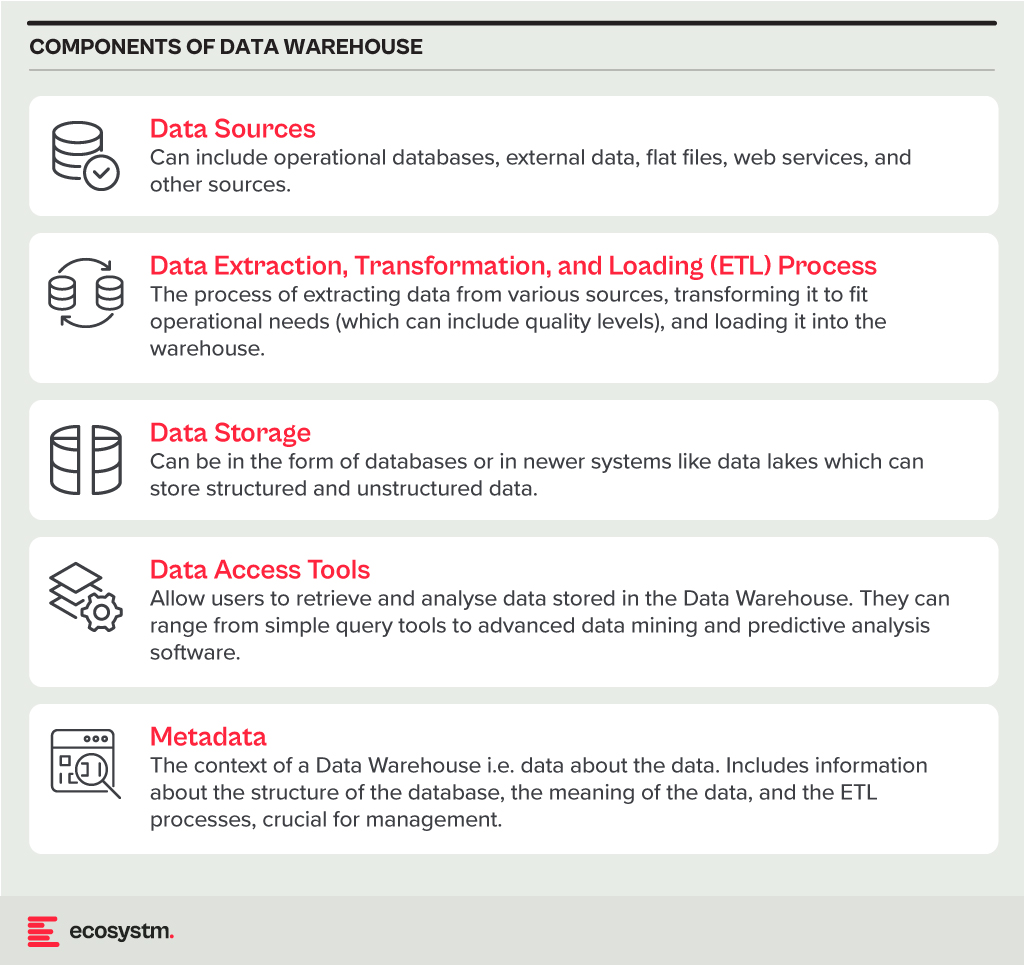
Data Warehouse
A Data Warehouse is a centralised repository that stores vast amounts of data from diverse sources within an organisation. Its main function is to support reporting and data analysis, aiding businesses in making informed decisions. This concept encompasses both data storage and the consolidation and management of data from various sources to offer valuable business insights. Data Warehousing evolves alongside technological advancements, with trends like cloud-based solutions, real-time capabilities, and the integration of AI and machine learning for predictive analytics shaping its future.
Core Characteristics
- Integrated. It integrates data from multiple sources, ensuring consistent definitions and formats. This often includes data cleansing and transformation for analysis suitability.
- Subject-Oriented. Unlike operational databases, which prioritise transaction processing, it is structured around key business subjects like customers, products, and sales. This organisation facilitates complex queries and analysis.
- Non-Volatile. Data in a Data Warehouse is stable; once entered, it is not deleted. Historical data is retained for analysis, allowing for trend identification over time.
- Time-Variant. It retains historical data for trend analysis across various time periods. Each entry is time-stamped, enabling change tracking and trend analysis.
Benefits
- Better Decision Making. Data Warehouses consolidate data from multiple sources, offering a comprehensive business view for improved decision-making.
- Enhanced Data Quality. The ETL process ensures clean and consistent data entry, crucial for accurate analysis.
- Historical Analysis. Storing historical data enables trend analysis over time, informing future strategies.
- Improved Efficiency. Data Warehouses enable swift access and analysis of relevant data, enhancing efficiency and productivity.
Challenges
- Complexity. Designing and implementing a Data Warehouse can be complex and time-consuming.
- Cost. The cost of hardware, software, and specialised personnel can be significant.
- Data Security. Storing large amounts of sensitive data in one place poses security risks, requiring robust security measures.
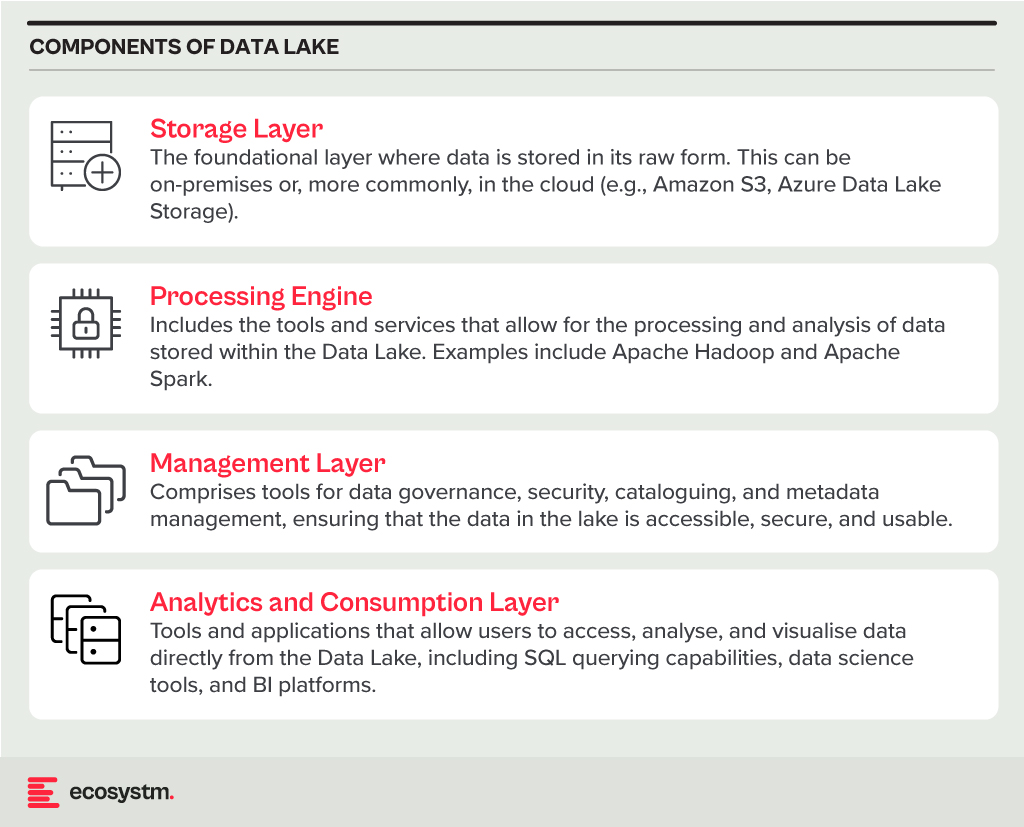
Data Lake
A Data Lake is a centralised repository for storing, processing, and securing large volumes of structured and unstructured data. Unlike traditional Data Warehouses, which are structured and optimised for analytics with predefined schemas, Data Lakes retain raw data in its native format. This flexibility in data usage and analysis makes them crucial in modern data architecture, particularly in the age of big data and cloud.
Core Characteristics
- Schema-on-Read Approach. This means the data structure is not defined until the data is read for analysis. This offers more flexible data storage compared to the schema-on-write approach of Data Warehouses.
- Support for Multiple Data Types. Data Lakes accommodate diverse data types, including structured (like databases), semi-structured (like JSON, XML files), unstructured (like text and multimedia files), and binary data.
- Scalability. Designed to handle vast amounts of data, Data Lakes can easily scale up or down based on storage needs and computational demands, making them ideal for big data applications.
- Versatility. Data Lakes support various data operations, including batch processing, real-time analytics, machine learning, and data visualisation, providing a versatile platform for data science and analytics.
Benefits
- Flexibility. Data Lakes offer diverse storage formats and a schema-on-read approach for flexible analysis.
- Cost-Effectiveness. Cloud-hosted Data Lakes are cost-effective with scalable storage solutions.
- Advanced Analytics Capabilities. The raw, granular data in Data Lakes is ideal for advanced analytics, machine learning, and AI applications, providing deeper insights than traditional data warehouses.
Challenges
- Complexity and Management. Without proper management, a Data Lake can quickly become a “Data Swamp” where data is disorganised and unusable.
- Data Quality and Governance. Ensuring the quality and governance of data within a Data Lake can be challenging, requiring robust processes and tools.
- Security. Protecting sensitive data within a Data Lake is crucial, requiring comprehensive security measures.
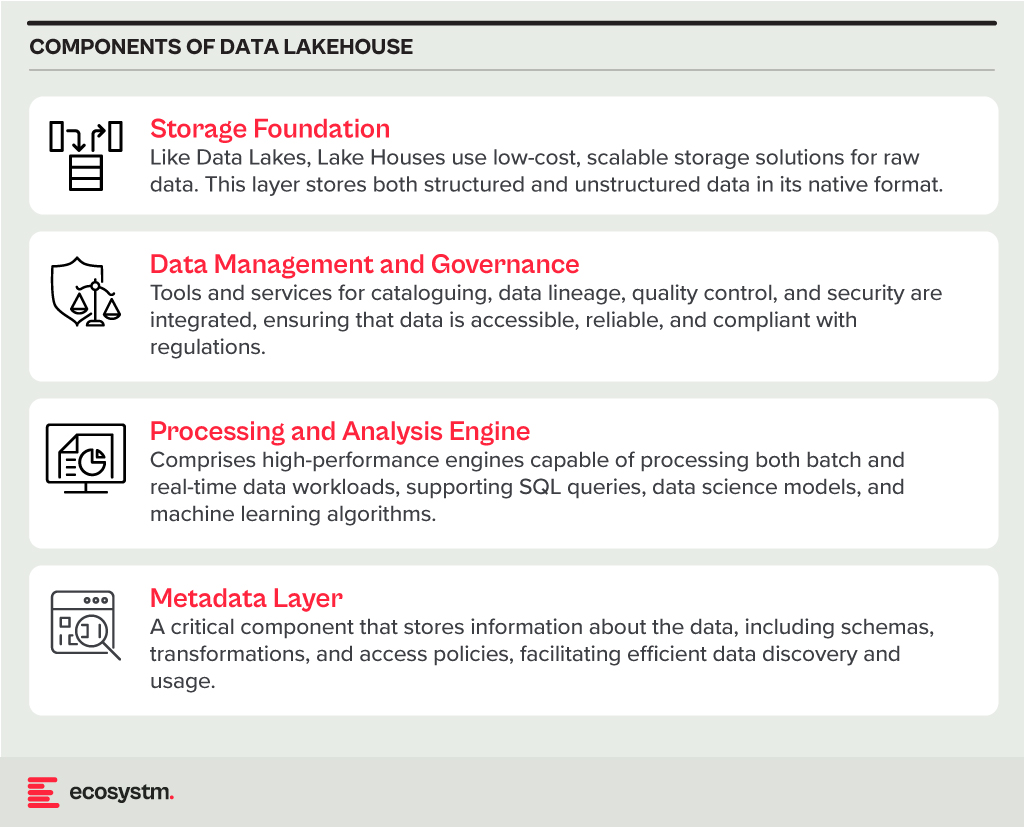
Data Lakehouse
A Data Lakehouse is an innovative data management system that merges the strengths of Data Lakes and Data Warehouses. This hybrid approach strives to offer the adaptability and expansiveness of a Data Lake for housing extensive volumes of raw, unstructured data, while also providing the structured, refined data functionalities typical of a Data Warehouse. By bridging the gap between these two traditional data storage paradigms, Lakehouses enable more efficient data analytics, machine learning, and business intelligence operations across diverse data types and use cases.
Core Characteristics
- Unified Data Management. A Lakehouse streamlines data governance and security by managing both structured and unstructured data on one platform, reducing organizational data silos.
- Schema Flexibility. It supports schema-on-read and schema-on-write, allowing data to be stored and analysed flexibly. Data can be ingested in raw form and structured later or structured at ingestion.
- Scalability and Performance. Lakehouses scale storage and compute resources independently, handling large data volumes and complex analytics without performance compromise.
- Advanced Analytics and Machine Learning Integration. By providing direct access to both raw and processed data on a unified platform, Lakehouses facilitate advanced analytics, real-time analytics, and machine learning.
Benefits
- Versatility in Data Analysis. Lakehouses support diverse data analytics, spanning from traditional BI to advanced machine learning, all within one platform.
- Cost-Effective Scalability. The ability to scale storage and compute independently, often in a cloud environment, makes Lakehouses cost-effective for growing data needs.
- Improved Data Governance. Centralising data management enhances governance, security, and quality across all types of data.
Challenges
- Complexity in Implementation. Designing and implementing a Lakehouse architecture can be complex, requiring expertise in both Data Lakes and Data Warehouses.
- Data Consistency and Quality. Though crucial for reliable analytics, ensuring data consistency and quality across diverse data types and sources can be challenging.
- Governance and Security. Comprehensive data governance and security strategies are required to protect sensitive information and comply with regulations.
The choice between Data Warehouse, Data Lake, or Lakehouse systems is pivotal for businesses in harnessing the power of their data. Each option offers distinct advantages and challenges, requiring careful consideration of organisational needs and goals. By embracing the right data management system, organisations can pave the way for informed decision-making, operational efficiency, and innovation in the digital age.
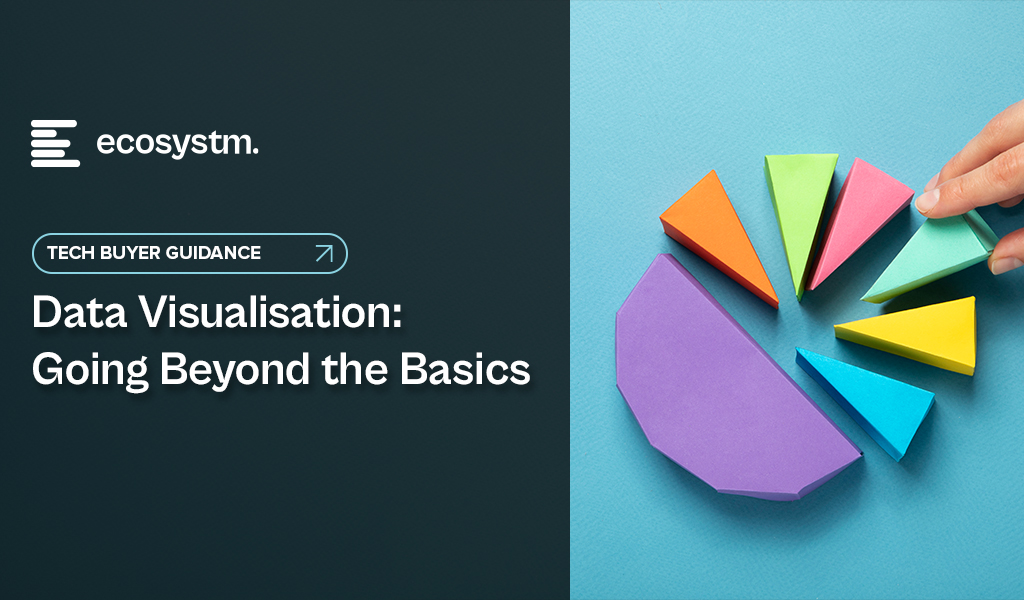
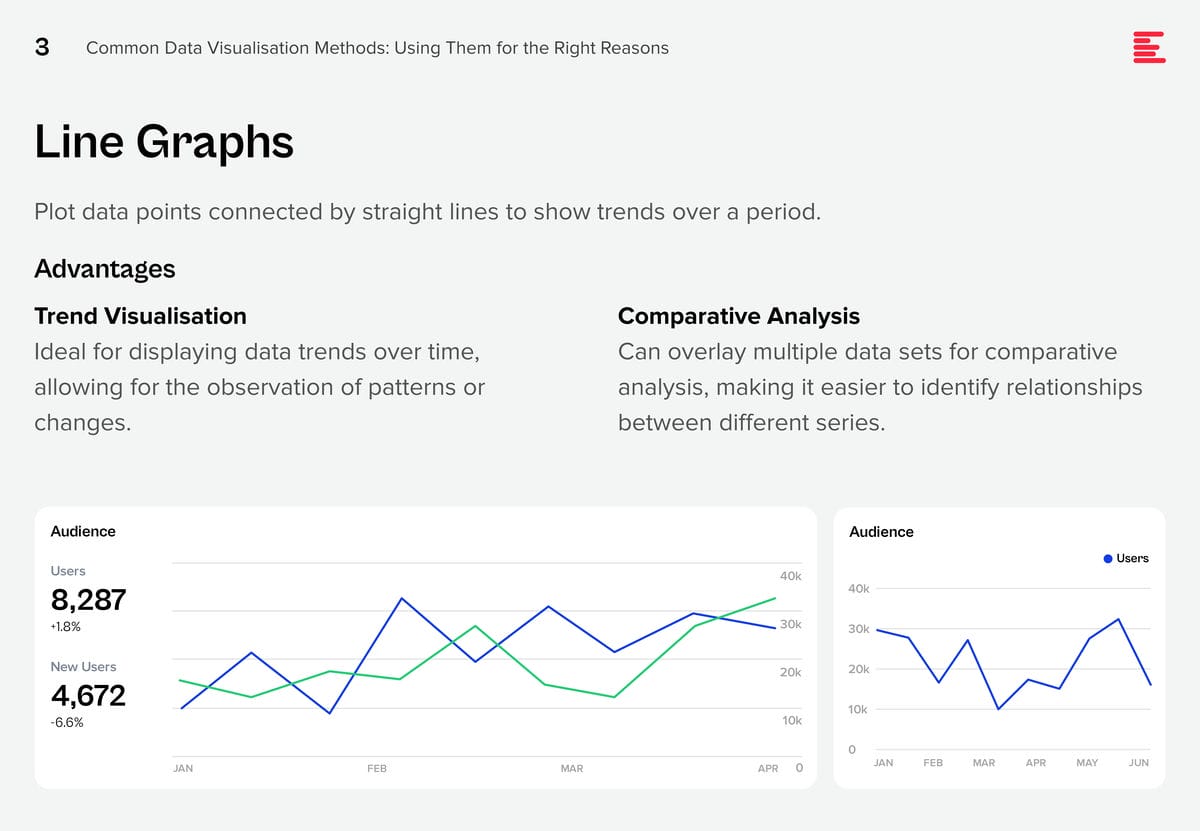
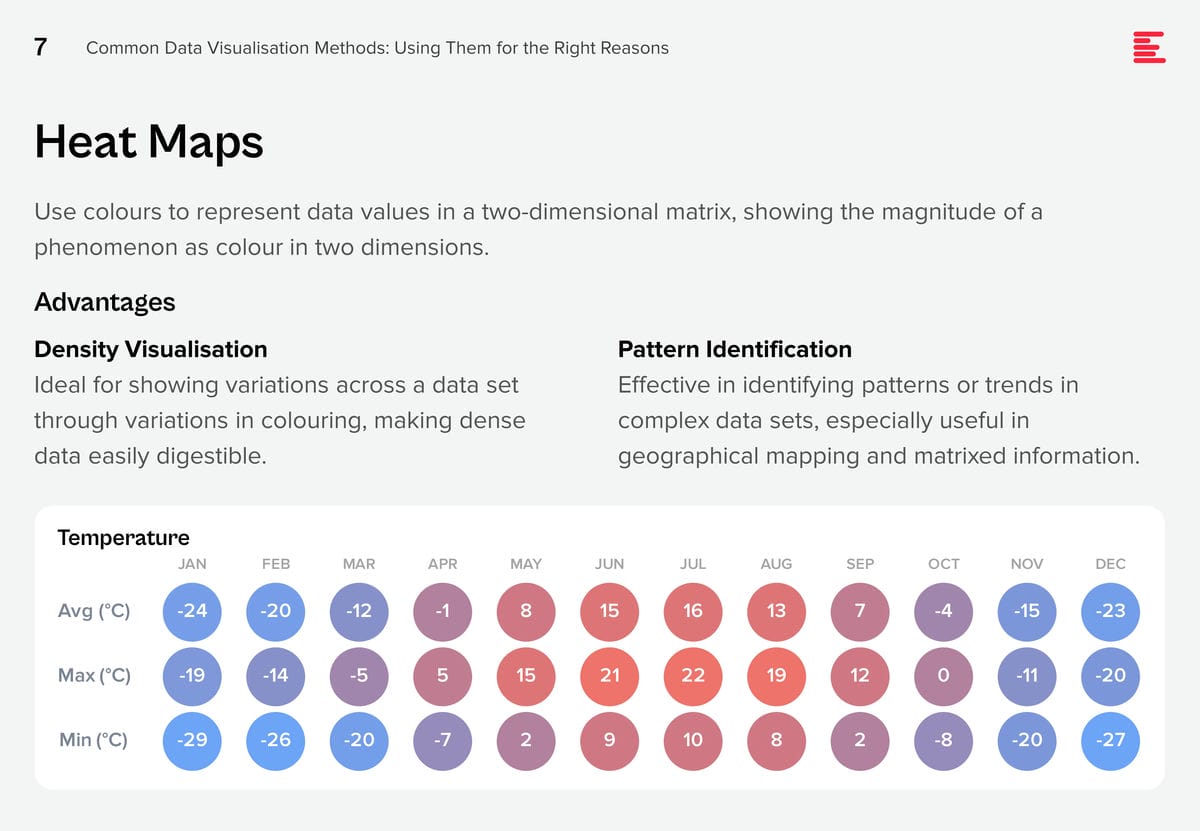
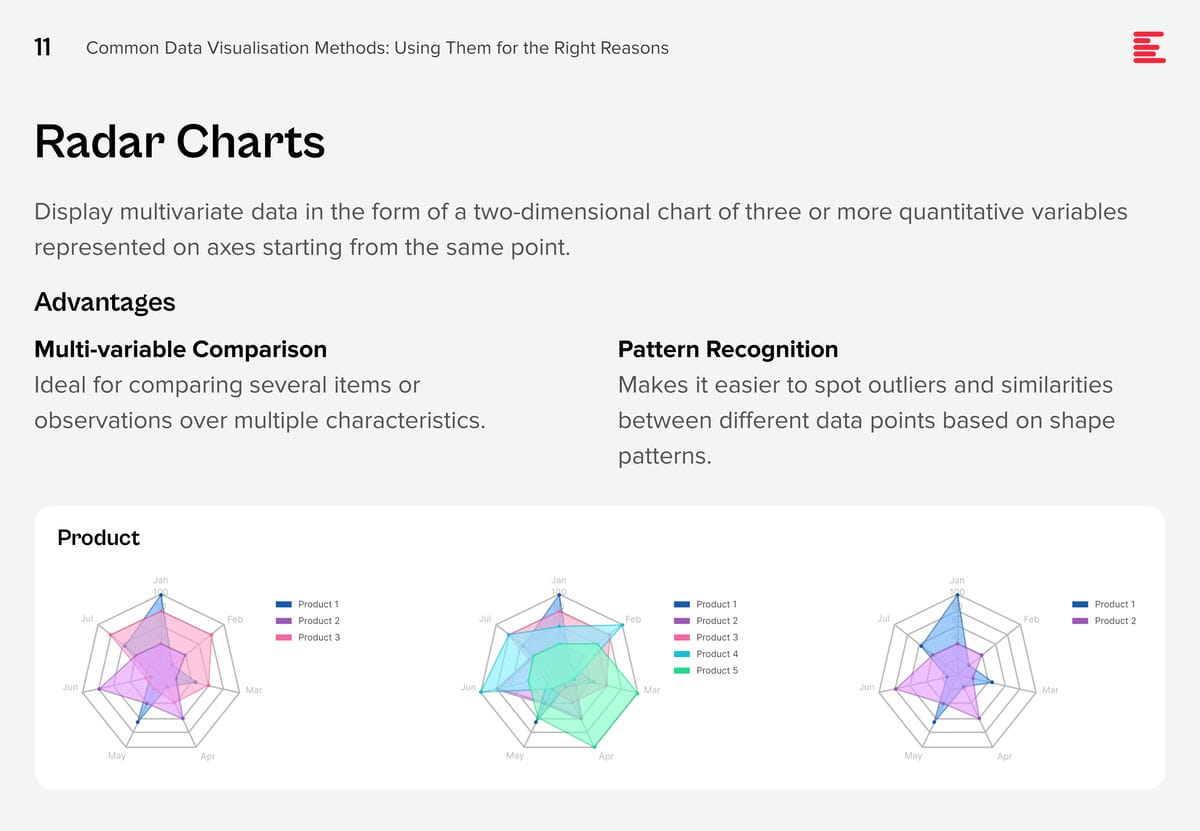
AI systems are creating huge amounts of data at a rapid rate. While this flood of information is extremely valuable, it is also difficult to analyse and understand. Organisations need to make sense of these large data sets to derive useful insights and make better decisions. Data visualisation plays a pivotal role in the interpretation of complex data, making it accessible, understandable, and actionable. Well-designed visualisation can translate complex, high-dimensional data into intuitive, visually appealing representations, helping stakeholders to understand patterns, trends, and anomalies that would otherwise be challenging to recognise.
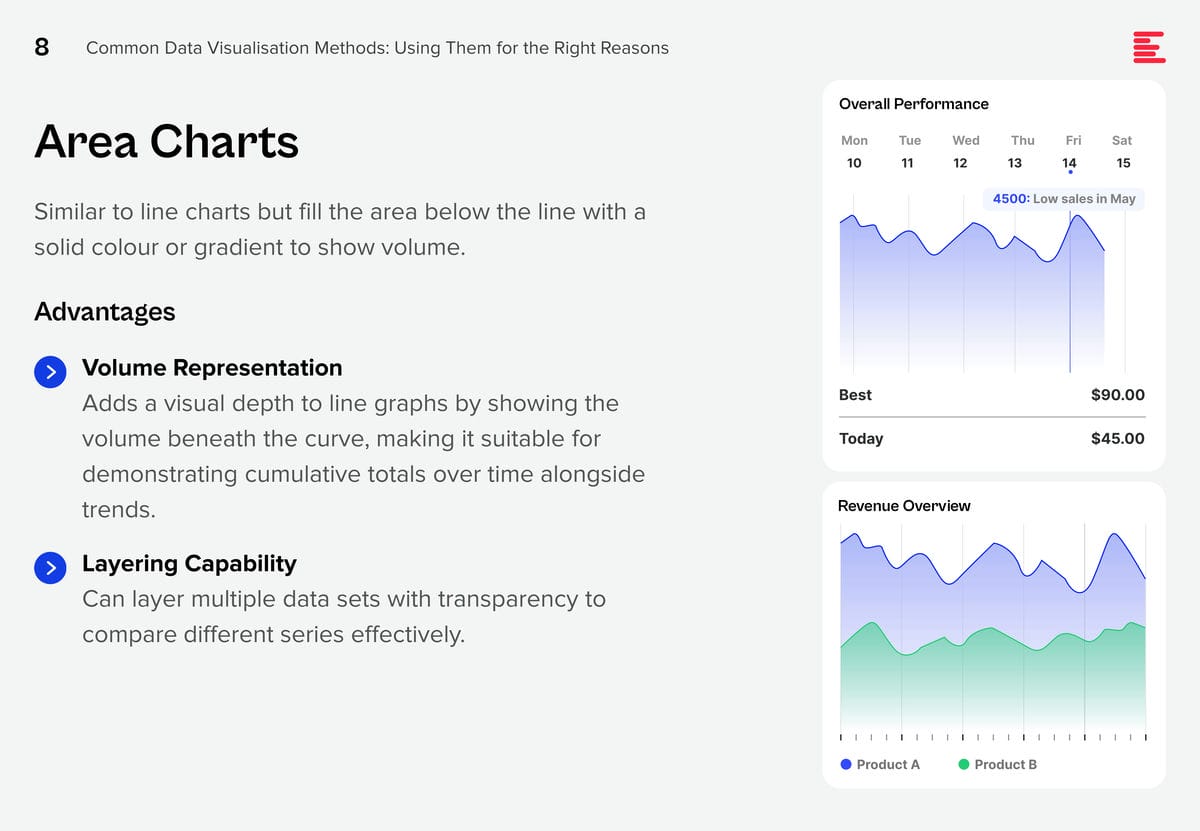
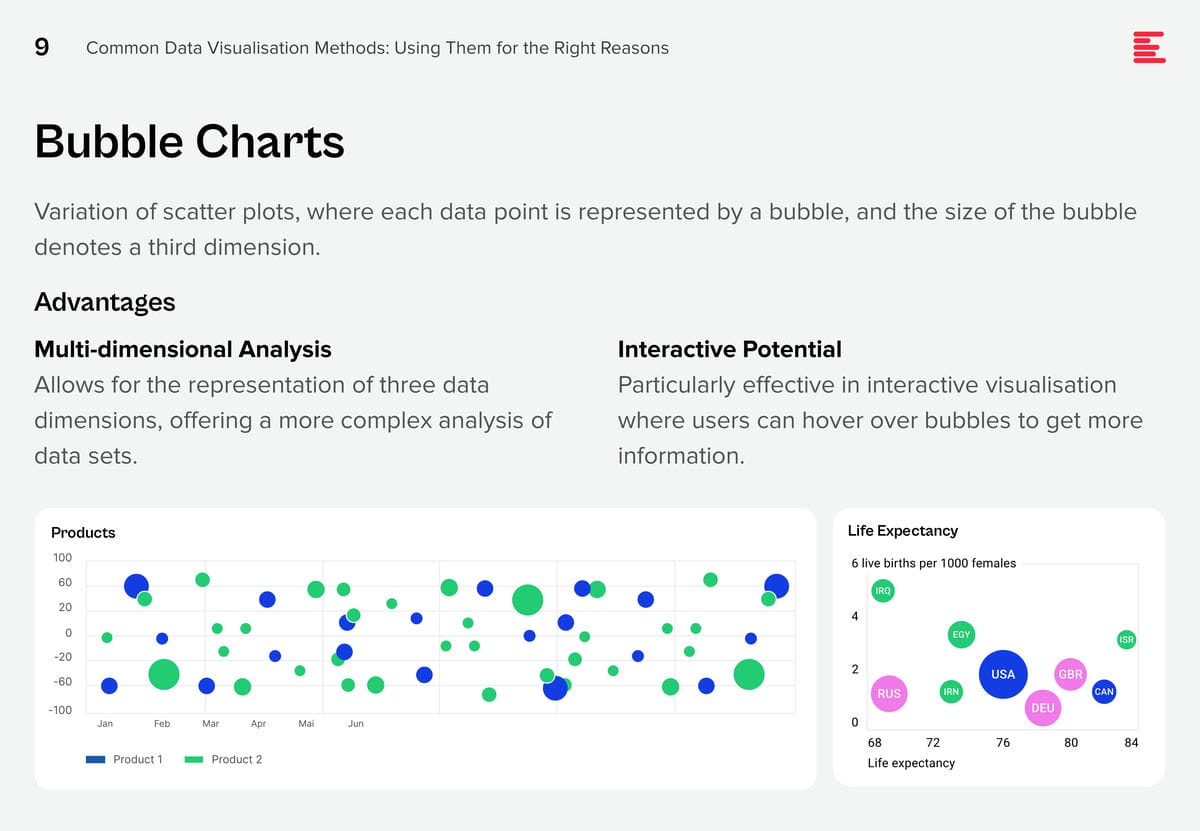
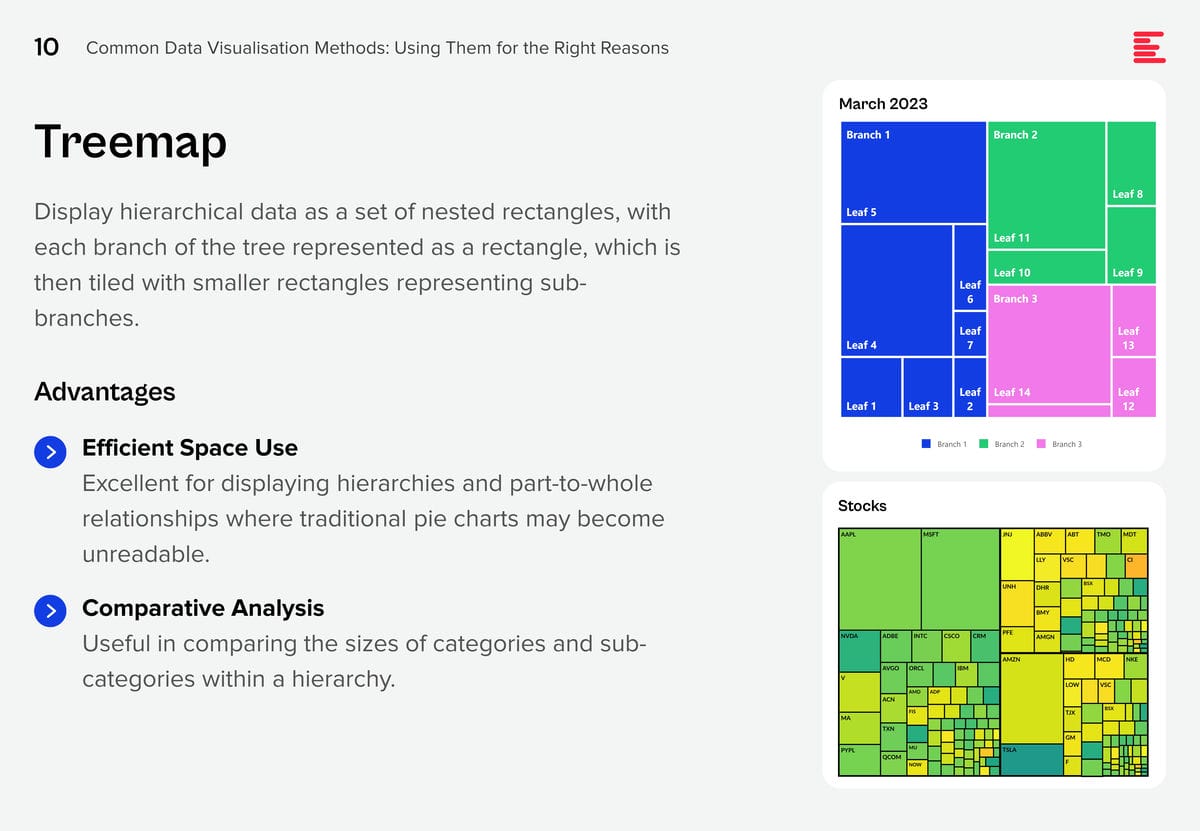
There are some data visualisation methods that you are using already; and some that you definitely should master as data complexity increases and there is more demand from business teams for better data visualisation.
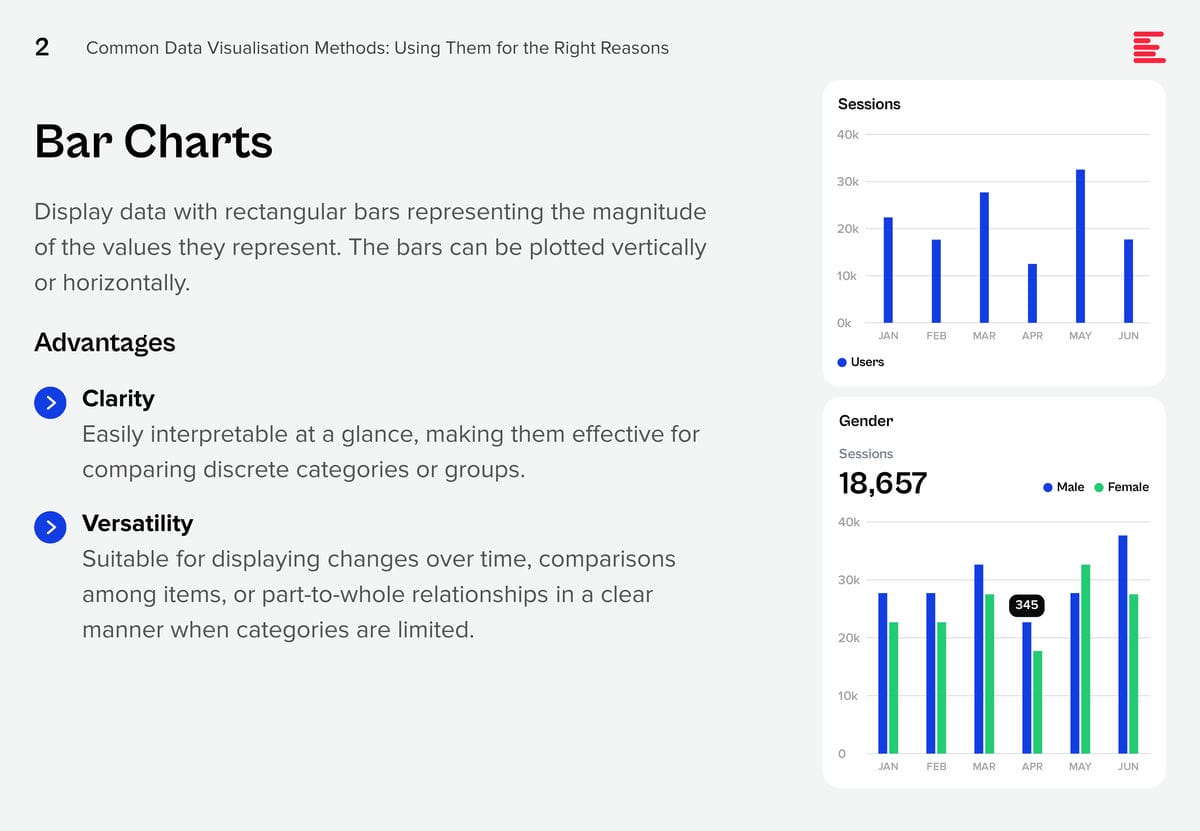

Download Common Data Visualisation Methods as a PDF
Add These to Your Data Visualisation Repertoire
There are additional visualisation tools that you should be using to tell a better data story. Each of these visualisation techniques serves specific purposes in data analysis, offering unique advantages for representing data insights.
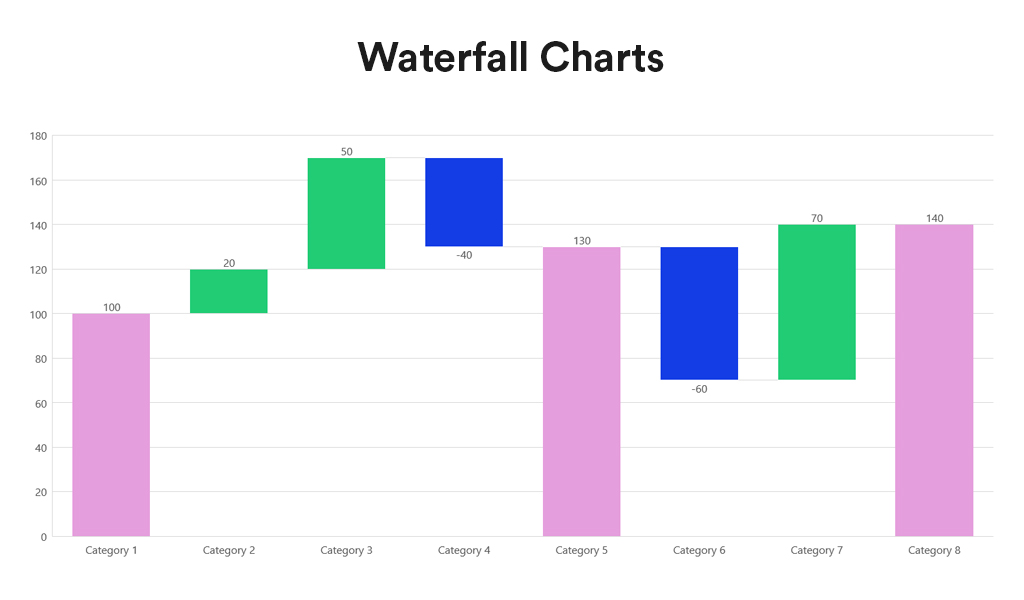
Waterfall charts depict the impact of intermediate positive and negative values on an initial value, often resulting in a final value. They are commonly employed in financial analysis to illustrate the contribution of various factors to a total, making them ideal for visualising step-by-step financial contributions or tracking the cumulative effect of sequentially introduced factors.
Advantages:
- Sequential Analysis. Ideal for understanding the cumulative effect of sequentially introduced positive or negative values.
- Financial Reporting. Commonly used for financial statements to break down the contributions of various elements to a net result, such as revenues, costs, and profits over time.
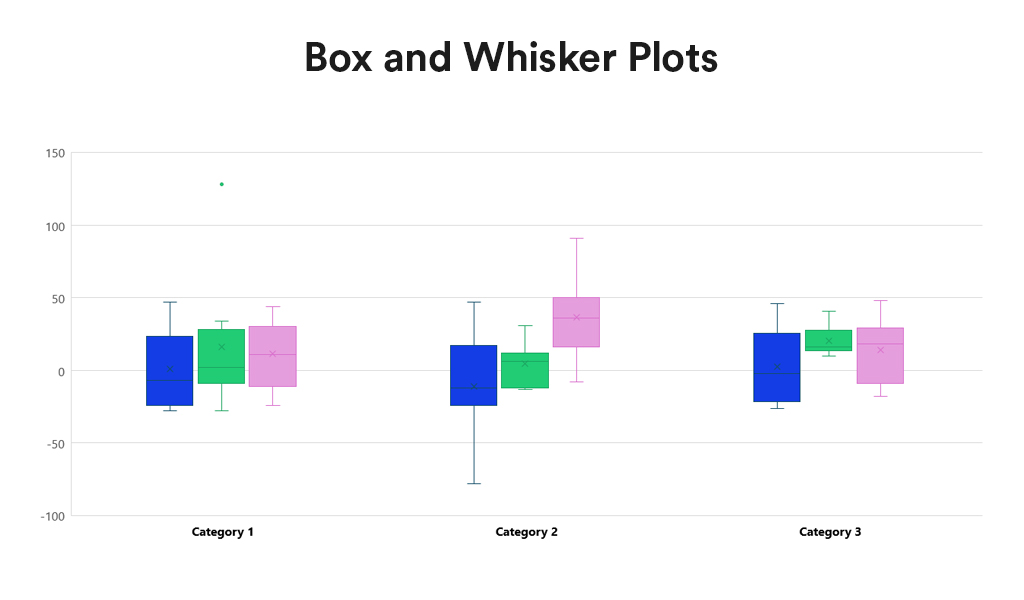
Box and Whisker Plots summarise data distribution using a five-number summary: minimum, first quartile (Q1), median, third quartile (Q3), and maximum. They are valuable for showcasing data sample variations without relying on specific statistical assumptions. Box and Whisker Plots excel in comparing distributions across multiple groups or datasets, providing a concise overview of various statistics.
Advantages:
- Distribution Clarity. Provide a clear view of the data distribution, including its central tendency, variability, and skewness.
- Outlier Identification. Easily identify outliers, offering insights into the spread and symmetry of the data.
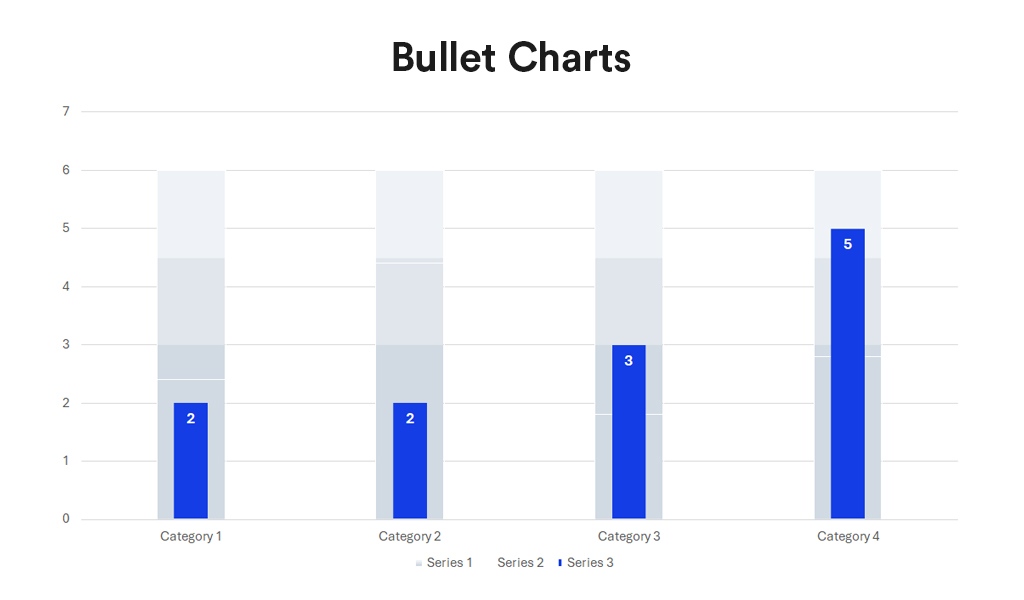
Bullet charts, a bar graph variant, serve as a replacement for dashboard gauges and meters. They showcase a primary measure alongside one or more other measures for context, such as a target or previous period’s performance, often incorporating qualitative ranges like poor, satisfactory, and good. Ideal for performance dashboards with limited space, bullet charts efficiently demonstrate progress towards goals.
Advantages:
- Compactness. Offer a compact and straightforward way to monitor performance against a target.
- Efficiency. More efficient than gauges and meters in dashboard design, as they take up less space and can display more information, making them ideal for comparing multiple measures.
Conclusion
Each data visualisation type has its unique strengths, making it better suited for certain types of data and analysis than others. The key to effective data visualisation lies in matching the visualisation type to your data’s specific needs, considering the story you want, to tell or the insights you aim to glean. Choosing the right data representation helps you to make informed decisions that enhance your data analysis and communication efforts.
Incorporating Waterfall Charts, Box and Whisker Plots, and Bullet Charts into the data visualisation toolkit allows for a broader range of insights to be derived from your data. From analysing financial data, comparing distributions, to tracking performance metrics, these additional types of visualisation can communicate complex data stories clearly and effectively. As with all data visualisation, the key is to choose the type that best matches the organisation’s data story, making it accessible and understandable to the audience.