
Data analysts play a vital role in today’s data-driven world, providing crucial insights that benefit decision-making processes. For those with a knack for numbers and a passion for uncovering patterns, a career as a data analyst can be both fulfilling and lucrative – it can also be a stepping stone towards other careers in data. While a data analyst focuses on data preparation and visualisation, an AI engineer specialises in creating AI solutions, a machine learning (ML) engineer concentrates on implementing ML models, and a data scientist combines elements of data analysis and ML to derive insights and predictions from data.
Tools, Skills, and Techniques of a Data Analyst
Excel Mastery. Unlocks a powerful toolbox for data manipulation and analysis. Essential skills include using a vast array of functions for calculations and data transformation. Pivot tables become your secret weapon for summarising and analysing large datasets, while charts and graphs bring your findings to life with visual clarity. Data validation ensures accuracy, and the Analysis ToolPak and Solver provide advanced functionalities for statistical analysis and complex problem-solving. Mastering Excel empowers you to transform raw data into actionable insights.
Advanced SQL. While basic skills handle simple queries, advanced users can go deeper with sorting, aggregation, and the art of JOINs to combine data from multiple tables. Common Table Expressions (CTEs) and subqueries become your allies for crafting complex queries, while aggregate functions summarise vast amounts of data. Window functions add another layer of power, allowing calculations within query results. Mastering Advanced SQL empowers you to extract hidden insights and manage data with unparalleled precision.
Data Visualisation. Crafts impactful data stories. These tools empower you to connect to various data sources, transform raw information into a usable format, and design interactive dashboards and reports. Filters and drilldowns allow users to explore your data from different angles, while calculated fields unlock deeper analysis. Parameters add a final touch of flexibility, letting viewers customise the report to their specific needs. With tools Tableau and Power BI, complex data becomes clear and engaging.
Essential Python. This powerful language excels at data analysis and automation. Libraries like NumPy and Pandas become your foundation for data manipulation and wrangling. Scikit-learn empowers you to build ML models, while SciPy and StatsModels provide a toolkit for in-depth statistical analysis. Python’s ability to interact with APIs and web scrape data expands its reach, and its automation capabilities streamline repetitive tasks. With Essential Python, you have the power to solve complex problems.
Automating the Journey. Data analysts can be masters of efficiency, and their skills translate beautifully into AI. Scripting languages like Ansible and Terraform automate repetitive tasks. Imagine streamlining the process of training and deploying AI models – a skill that directly benefits the AI development pipeline. This proficiency in automation showcases the valuable foundation data analysts provide for building and maintaining AI systems.
Developing ML Expertise. Transitioning from data analysis to AI involves building on your existing skills to develop ML expertise. As a data analyst, you may start with basic predictive models. This knowledge is expanded in AI to include deep learning and advanced ML algorithms. Also, skills in statistical analysis and visualisation help in evaluating the performance of AI models.
Growing Your AI Skills
Becoming an AI engineer requires building on a data analysis foundation to focus on advanced skills such as:
- Deep Learning. Learning frameworks like TensorFlow and PyTorch to build and train neural networks.
- Natural Language Processing (NLP). Techniques for processing and analysing large amounts of natural language data.
- AI Ethics and Fairness. Understanding the ethical implications of AI and ensuring models are fair and unbiased.
- Big Data Technologies. Using tools like Hadoop and Spark for handling large-scale data is essential for AI applications.
The Evolution of a Data Analyst: Career Opportunities
Data analysis is a springboard to AI engineering. Businesses crave talent that bridges the data-AI gap. Your data analyst skills provide the foundation (understanding data sources and transformations) to excel in AI. As you master ML, you can progress to roles like:
- AI Engineer. Works on integrating AI solutions into products and services. They work with AI frameworks like TensorFlow and PyTorch, ensuring that AI models are incorporated into products and services in a fair and unbiased manner.
- ML Engineer. Focuses on designing and implementing ML models. They focus on preprocessing data, evaluating model performance, and collaborating with data scientists and engineers to bring models into production. They need strong programming skills and experience with big data tools and ML algorithms.
- Data Scientist. Bridges the gap between data analysis and AI, often involved in both data preparation and model development. They perform exploratory data analysis, develop predictive models, and collaborate with cross-functional teams to solve complex business problems. Their role requires a comprehensive understanding of both data analysis and ML, as well as strong programming and data visualisation skills.
Conclusion
Hone your data expertise and unlock a future in AI! Mastering in-demand skills like Excel, SQL, Python, and data visualisation tools will equip you to excel as a data analyst. Your data wrangling skills will be invaluable as you explore ML and advanced algorithms. Also, your existing BI knowledge translates seamlessly into building and evaluating AI models. Remember, the data landscape is constantly evolving, so continue to learn to stay at the forefront of this dynamic field. By combining your data skills with a passion for AI, you’ll be well-positioned to tackle complex challenges and shape the future of AI.

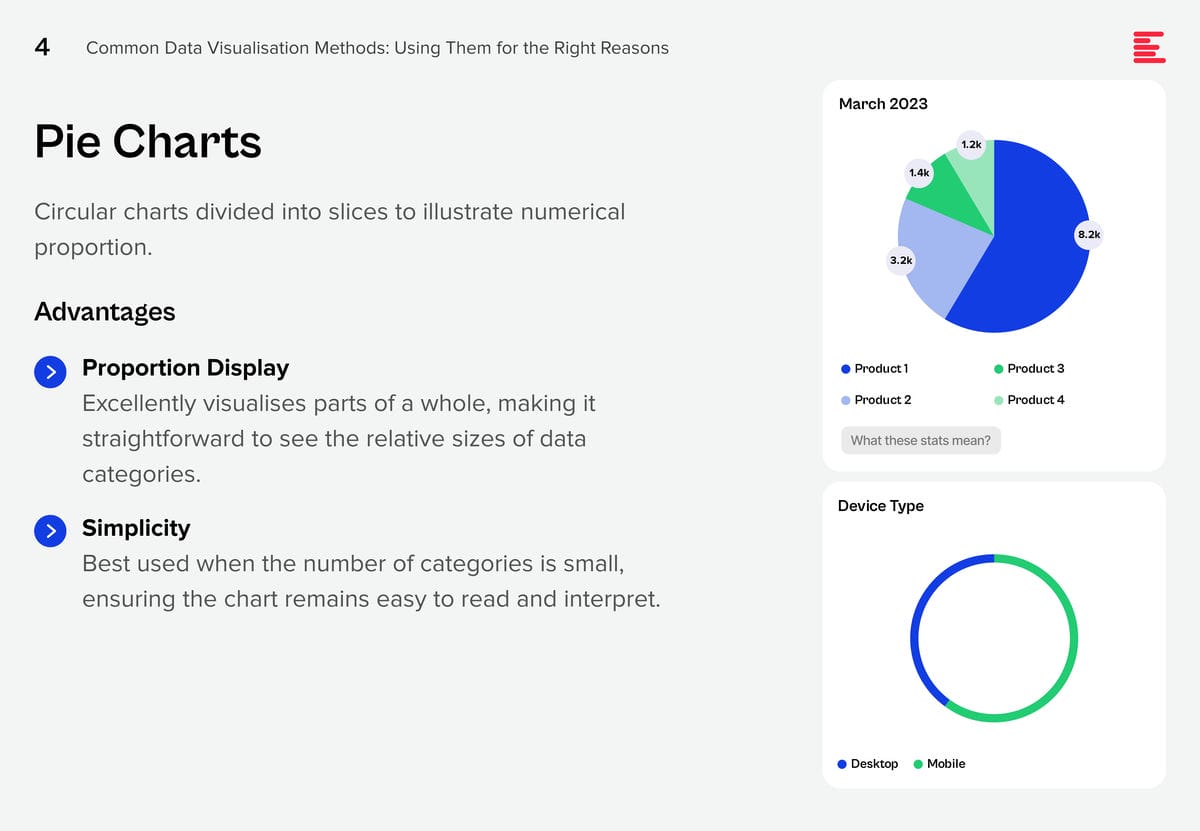
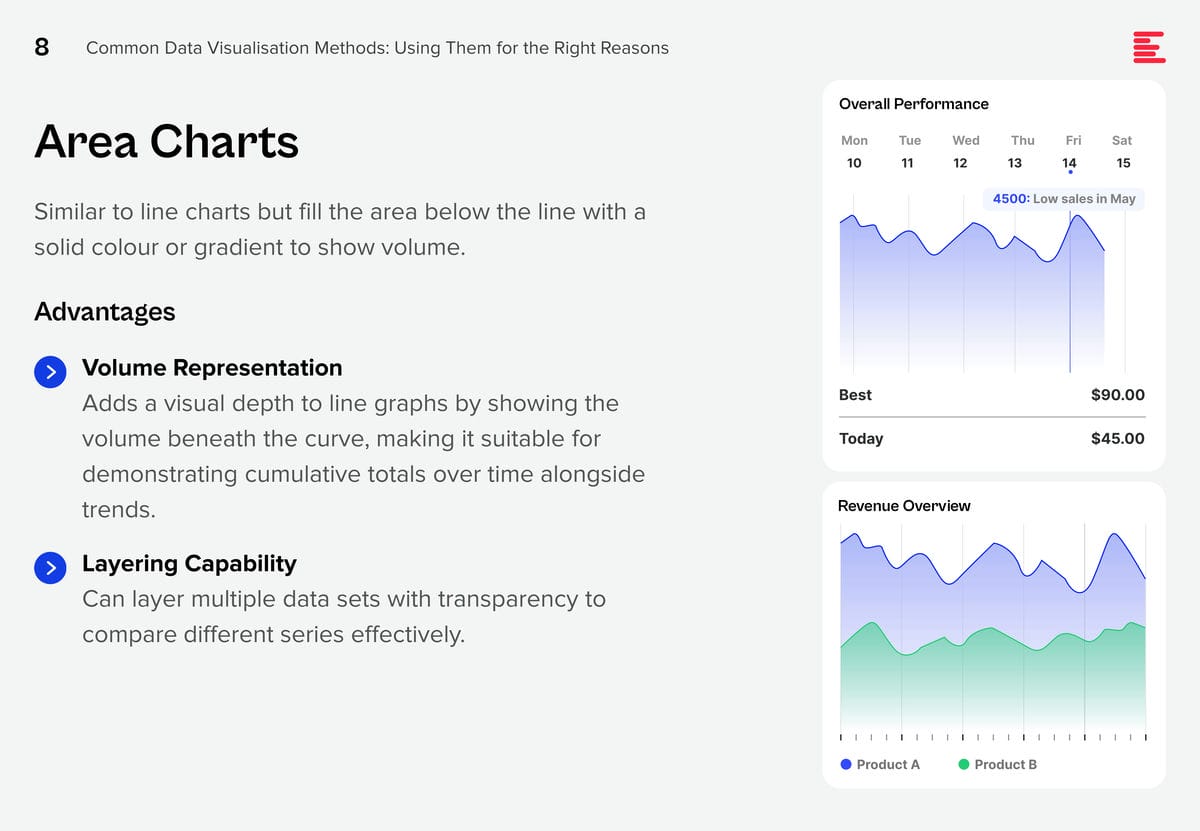
AI systems are creating huge amounts of data at a rapid rate. While this flood of information is extremely valuable, it is also difficult to analyse and understand. Organisations need to make sense of these large data sets to derive useful insights and make better decisions. Data visualisation plays a pivotal role in the interpretation of complex data, making it accessible, understandable, and actionable. Well-designed visualisation can translate complex, high-dimensional data into intuitive, visually appealing representations, helping stakeholders to understand patterns, trends, and anomalies that would otherwise be challenging to recognise.
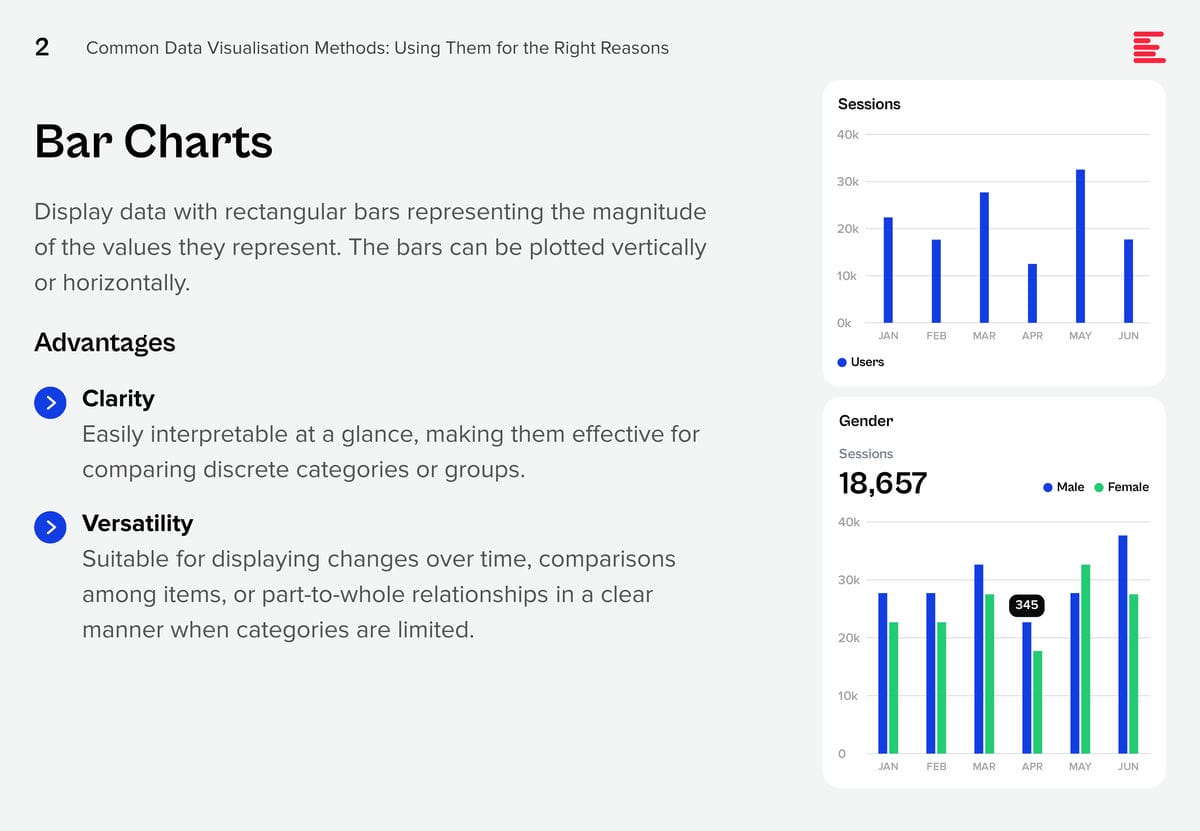
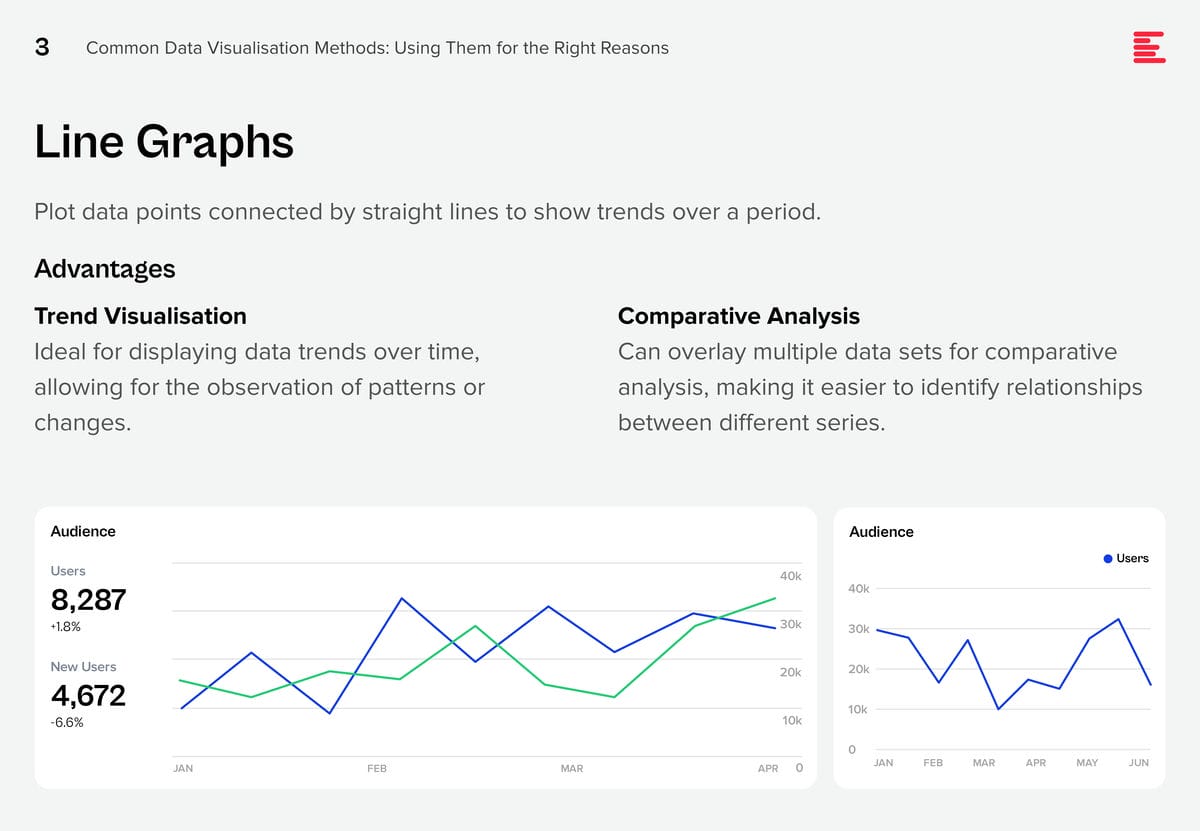
There are some data visualisation methods that you are using already; and some that you definitely should master as data complexity increases and there is more demand from business teams for better data visualisation.


Download Common Data Visualisation Methods as a PDF
Add These to Your Data Visualisation Repertoire
There are additional visualisation tools that you should be using to tell a better data story. Each of these visualisation techniques serves specific purposes in data analysis, offering unique advantages for representing data insights.
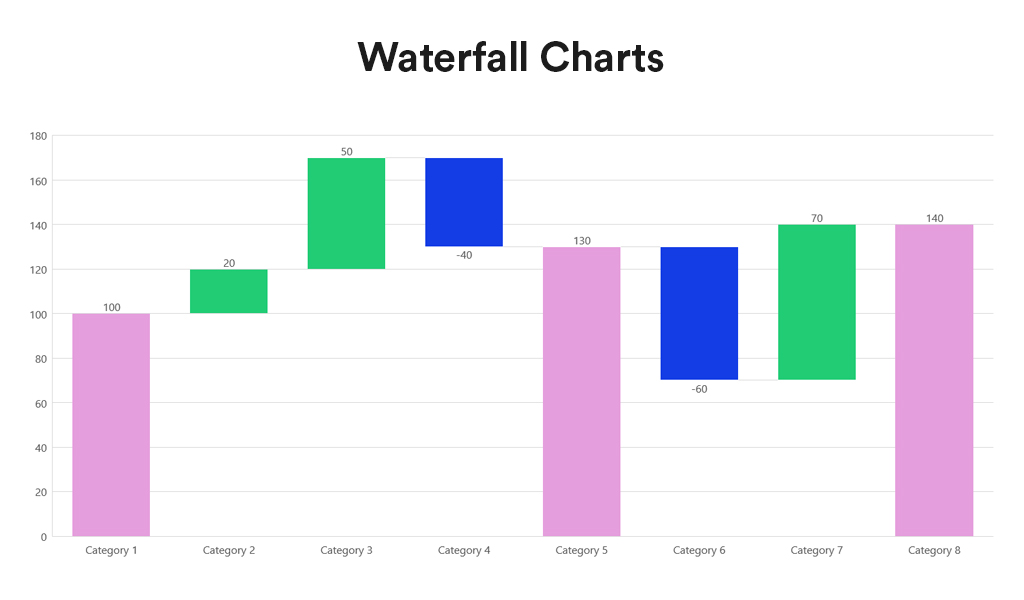
Waterfall charts depict the impact of intermediate positive and negative values on an initial value, often resulting in a final value. They are commonly employed in financial analysis to illustrate the contribution of various factors to a total, making them ideal for visualising step-by-step financial contributions or tracking the cumulative effect of sequentially introduced factors.
Advantages:
- Sequential Analysis. Ideal for understanding the cumulative effect of sequentially introduced positive or negative values.
- Financial Reporting. Commonly used for financial statements to break down the contributions of various elements to a net result, such as revenues, costs, and profits over time.
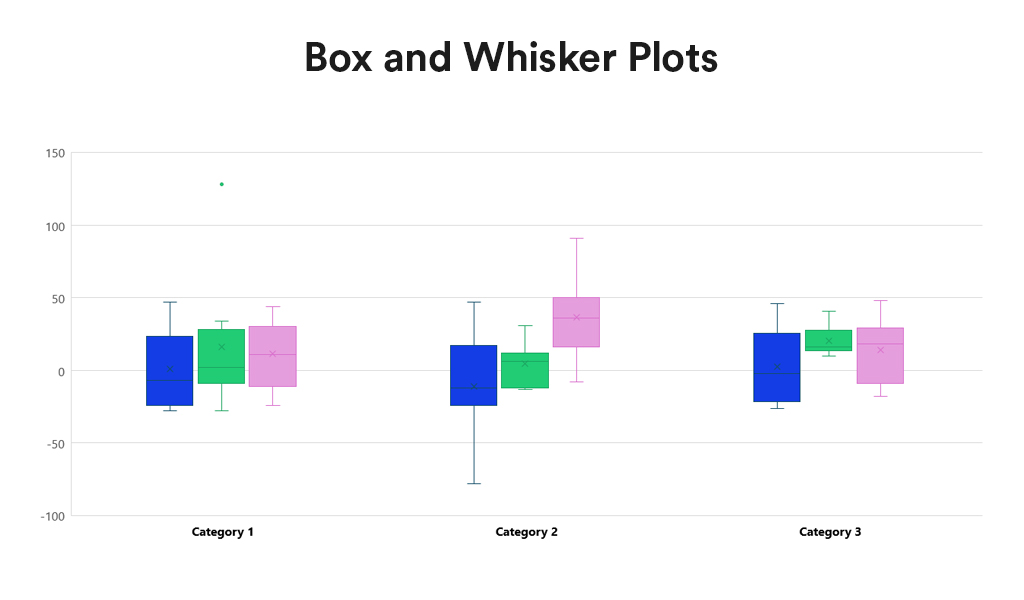
Box and Whisker Plots summarise data distribution using a five-number summary: minimum, first quartile (Q1), median, third quartile (Q3), and maximum. They are valuable for showcasing data sample variations without relying on specific statistical assumptions. Box and Whisker Plots excel in comparing distributions across multiple groups or datasets, providing a concise overview of various statistics.
Advantages:
- Distribution Clarity. Provide a clear view of the data distribution, including its central tendency, variability, and skewness.
- Outlier Identification. Easily identify outliers, offering insights into the spread and symmetry of the data.
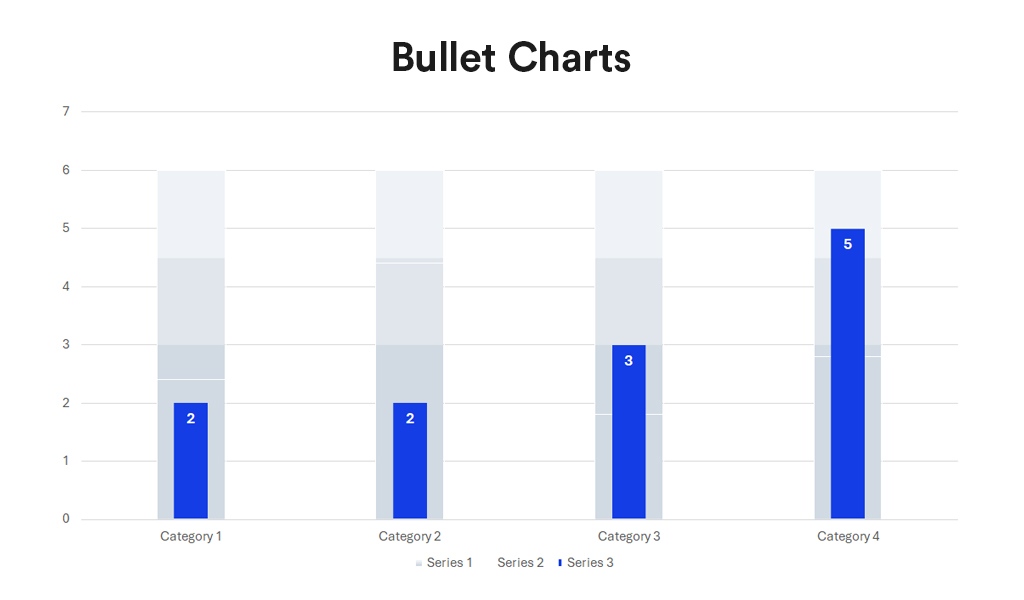
Bullet charts, a bar graph variant, serve as a replacement for dashboard gauges and meters. They showcase a primary measure alongside one or more other measures for context, such as a target or previous period’s performance, often incorporating qualitative ranges like poor, satisfactory, and good. Ideal for performance dashboards with limited space, bullet charts efficiently demonstrate progress towards goals.
Advantages:
- Compactness. Offer a compact and straightforward way to monitor performance against a target.
- Efficiency. More efficient than gauges and meters in dashboard design, as they take up less space and can display more information, making them ideal for comparing multiple measures.
Conclusion
Each data visualisation type has its unique strengths, making it better suited for certain types of data and analysis than others. The key to effective data visualisation lies in matching the visualisation type to your data’s specific needs, considering the story you want, to tell or the insights you aim to glean. Choosing the right data representation helps you to make informed decisions that enhance your data analysis and communication efforts.
Incorporating Waterfall Charts, Box and Whisker Plots, and Bullet Charts into the data visualisation toolkit allows for a broader range of insights to be derived from your data. From analysing financial data, comparing distributions, to tracking performance metrics, these additional types of visualisation can communicate complex data stories clearly and effectively. As with all data visualisation, the key is to choose the type that best matches the organisation’s data story, making it accessible and understandable to the audience.